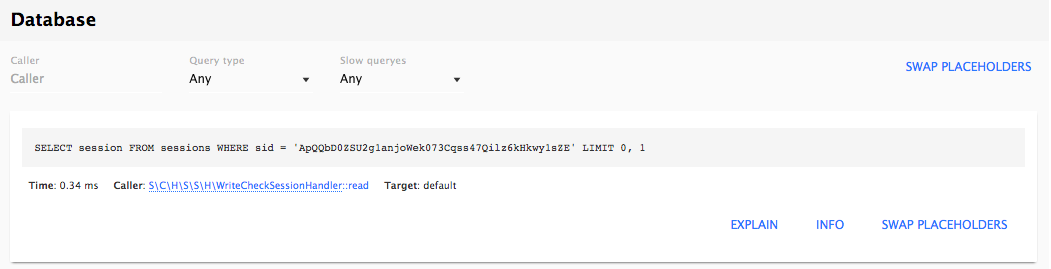
In Drupal 7, the Devel module could be toggled to display all database queries below the page. In the Web Profiler module, the Database tab shows these queries and allows you to filter, show the full query, and run an EXPLAIN on them.
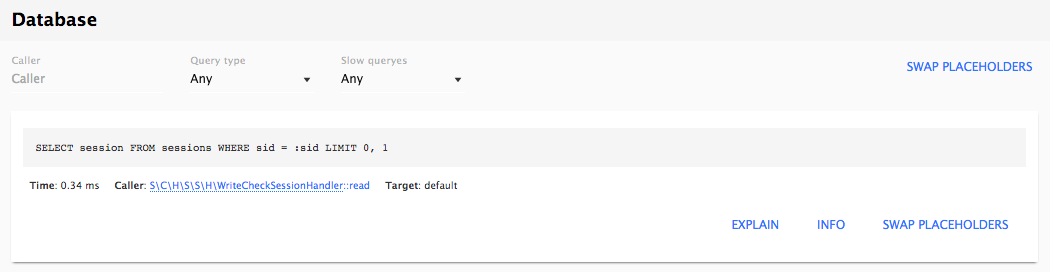
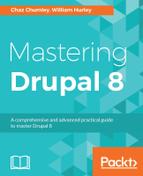
There are filters for Query types such as SELECT, INSERT, UPDATE, and so on, as well as whether the query is considered slow. For each query, you can see the values for each placeholder, as well as placing that value in the query to see what was presented to the database. You are also able to run the EXPLAIN command right from the interface and receive additional information about how the database processed the request.
For each query, you will also see a link to open the file that contains the query using the URL format as the Request information. Clicking on the link will use the IDE link configured earlier to open the file directly in your editor of choice.