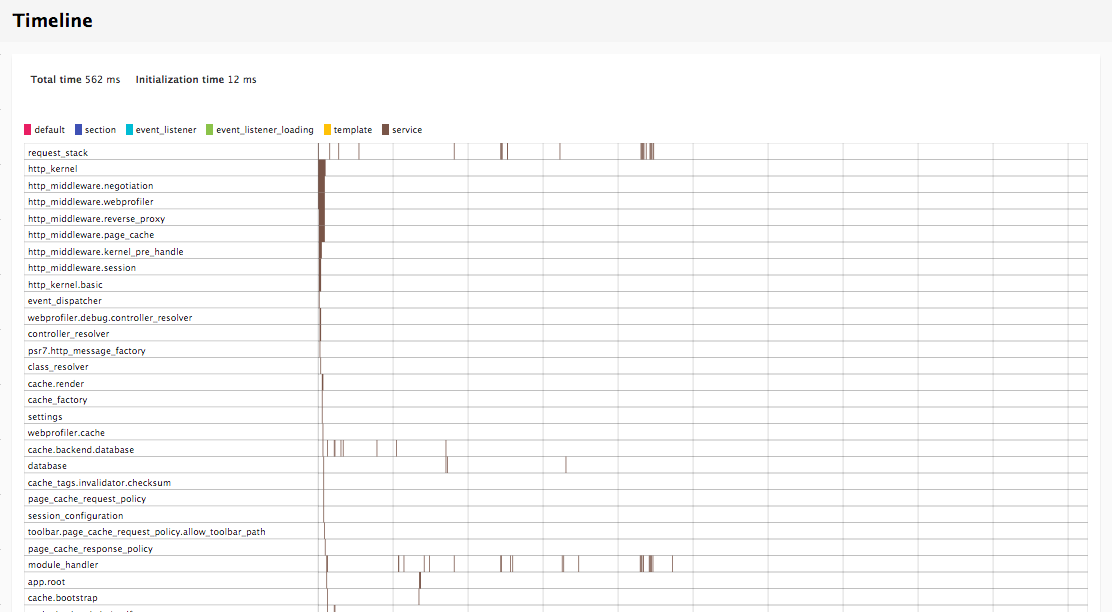
From the URL detail page, the third tab shows a waterfall view of the how the page is built. This waterfall is similar to the one found in the DevTools in Google Chrome or the profiler in Firefox. The visualization shows the order in which the controllers, events, templates, and so on are executed, as well as how long they take to compile and run, and how much memory is being used at each step.
It can allow you to trace the path from the initial request coming through to the final rendering of the page and can help spot areas that may need to be optimized.