
The last piece of configuration requires us to create a local.services.yml file that will handle the Null caching we set up earlier, as well as enable Twig debugging:
- First, we will need to copy development.services.yml, located in the /sites folder, to the /sites/default folder and rename the file to be called local.services.yml.
- Next, remove the following line:
parameters: httpd.response.debug_cacheability_headers: true
- Add the following lines to the bottom of the file:
       # Enable Twig debugging # # parameters: twig.config: debug: true
       auto_reload: true cache: false
- Save the file.
- Clear Drupal's cache.
We can validate that Twig debugging is now enabled by navigating back to our Drupal home page and using Google Chrome's Developer Tools to inspect the page. We should now see Twig comments displayed in various sections of the page:
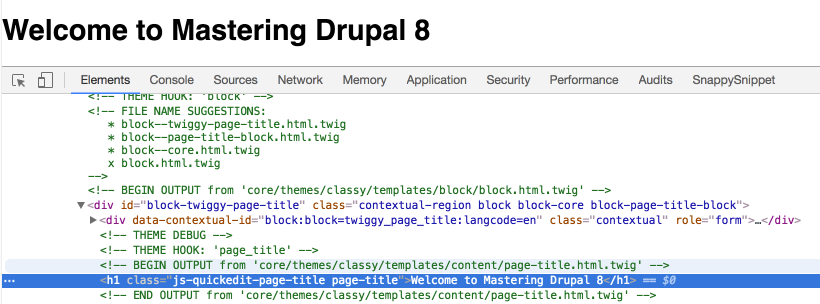
There are a couple of items we should make note of when Twig debugging is enabled:
- FILE NAME SUGGESTIONS: This displays suggestions to name Twig HTML templates and displays in the order of precedence in which Drupal folders would look for templates. The default template being used by Drupal also has an X next to the filename.
- OUTPUT: This displays the location of the template currently being displayed, which in the previous screenshot is /core/themes/classy/templates/content/page-title.html.twig.
Remember that we will only see the debug output when we have Twig debugging enabled as part of our local development environment. It is best to remember to disable debugging before moving a Drupal site to production.
So now that we understand what Twig debug provides us with, let's begin exploring some of the Twig syntax.