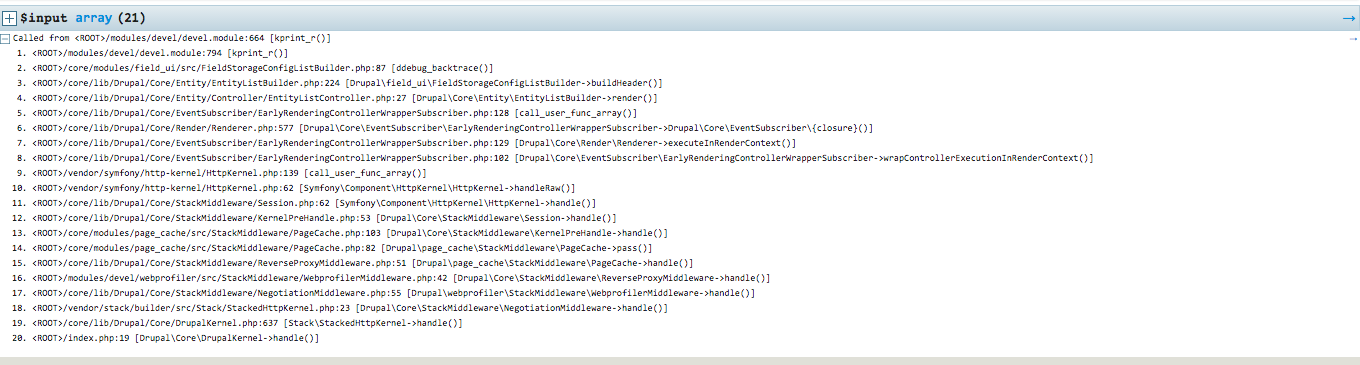
In addition to outputting information about a single variable, you can also do a full stack trace using Kint. By adding a call to ddebug_backtrace() in your function, it will output a list of all functions leading to the current one. Kint will output this in two ways, one as a simple list of the functions showing the function name, file name, and line number.
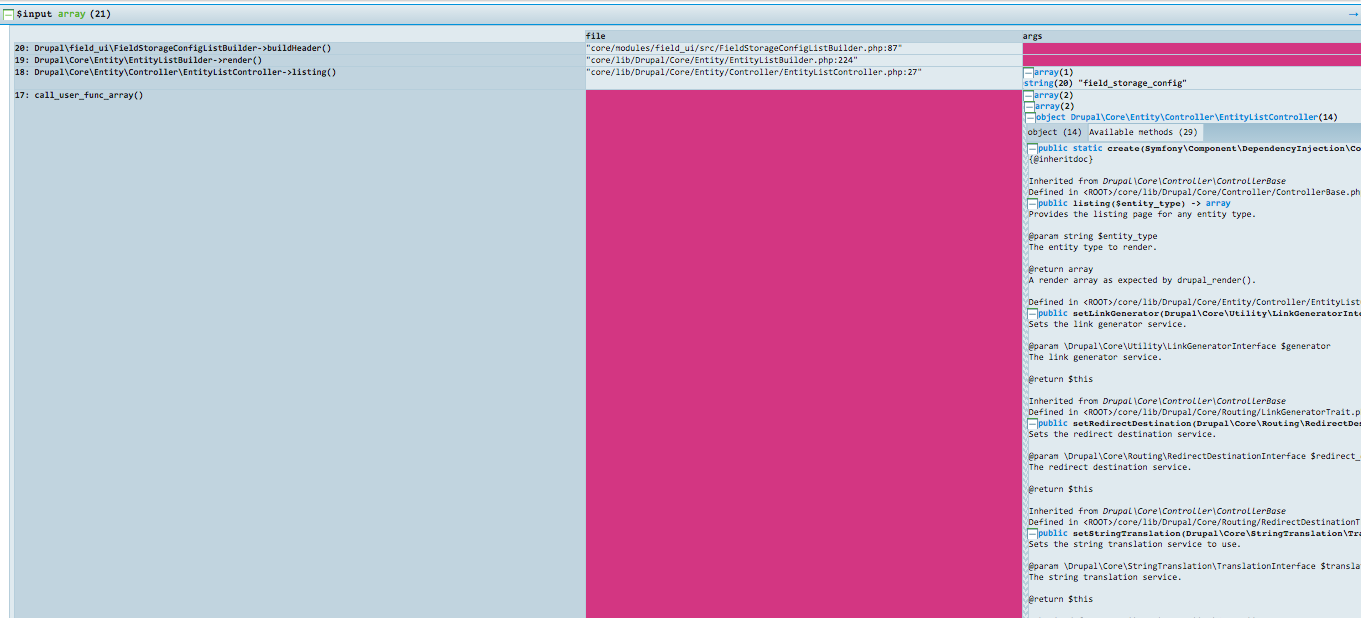
Clicking on the plus sign next to $input will show the same list of functions, file name, and line number, but it also shows the class name of the callers along with all variables passed to those functions. These are displayed using Kint and allow you to drill down into arrays and objects just as if you had run kint() on them.