I'll rerun the program using the up arrow key twice to return to the Node debug command. Then, I'll run the program, and I'll hit next twice, n and n:
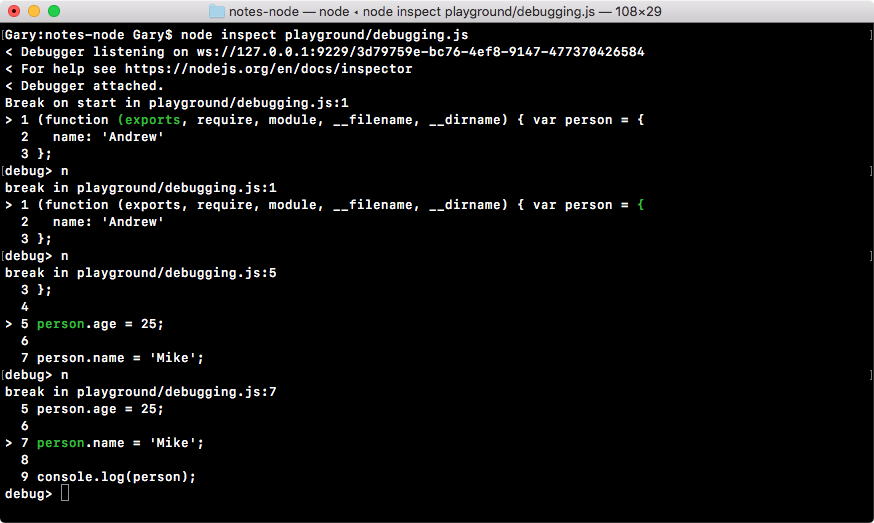
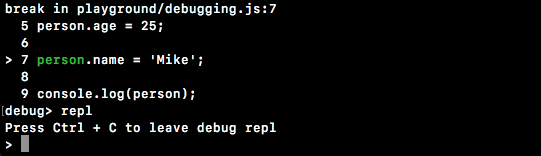
At this point in time, we are on line seven, that is where the line break currently is. From here we can do some debugging using a command called repl, which stands for Read Evaluate Print Loop. The repl command, in our case, brings you to an entirely separate area of the debugger. When you hit it you're essentially in a Node console:
You can run any Node commands, for example, I can use console.log to print something like test, and test prints up right there.
I can make a variable a that is equal to 1 plus 3, then I can reference a and I can see it's equal to 4 as shown:
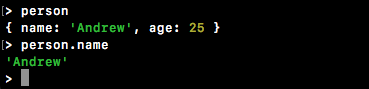
More importantly, we have access to the current program as it sits, meaning as it was before line seven was executed. We can use this to print out person, and as shown in the following code, you can see the person's name is Andrew because line seven hasn't executed and the age is 25, exactly as it appears in the program:
This is where debugging gets really useful. Being able to look at the program paused at a certain point in time is going to make it really easy to spot errors. I could do anything I want, I could print out the person name property, and that prints Andrew to the screen, as shown here:
Now, once again, we still have this problem. I have to hit next through the program. When you have a really long program, there could literally be hundreds or thousands of statements that need to run before you get to the point you care about. Obviously that is not ideal, so we're going to look at a better way.
Let's quit repl using control + C; now we're back at the debugger.
From here we are going to make a quick change to our application in debugging.js.
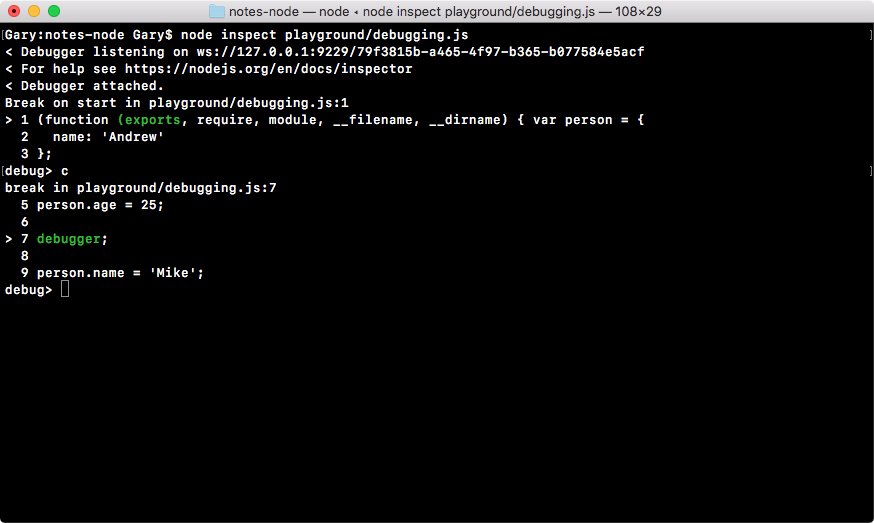
Let's say we want to pause line seven between the person age property update and the person name property update. In order to pause, what we're going to do is run the statement debugger:
var person = {
  name: 'Andrew'
};

person.age = 25;

debugger;

person.name = 'Mike';

console.log(person);
When you have a debugger statement exactly like previous, it tells the Node debugger to stop here, which means instead of using n (next) to go statement by statement, you can use c (continue), which is going to continue until either the program exits or it sees one of the debugger keywords.
Now, over in Terminal, we're going to rerun the program exactly like we did before. This time around, instead of hitting n twice, we're going to use c to continue:
Now, when we first used c, it went to the end of the program, printing out our object. This time around it's going to continue until it finds that debugger keyword.
Now, we can use repl, access anything we like, for example, person.age, shown in this code:
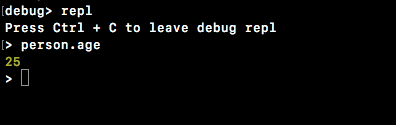
Once we're done debugging, we can quit and continue through the program. Again, we can use control + C to quit repl and the debugger.
All real debugging pretty much happens with the debugger keyword. You put it wherever you want on your program, you run the program in debug mode, eventually it gets to the debugger keyword and you do something. For example you explore some variable values, you run some functions, or you play around with a code to find the error. No one really uses n to print through the program, finding the line that causes the problem. That takes way too much time and it's just not realistic.