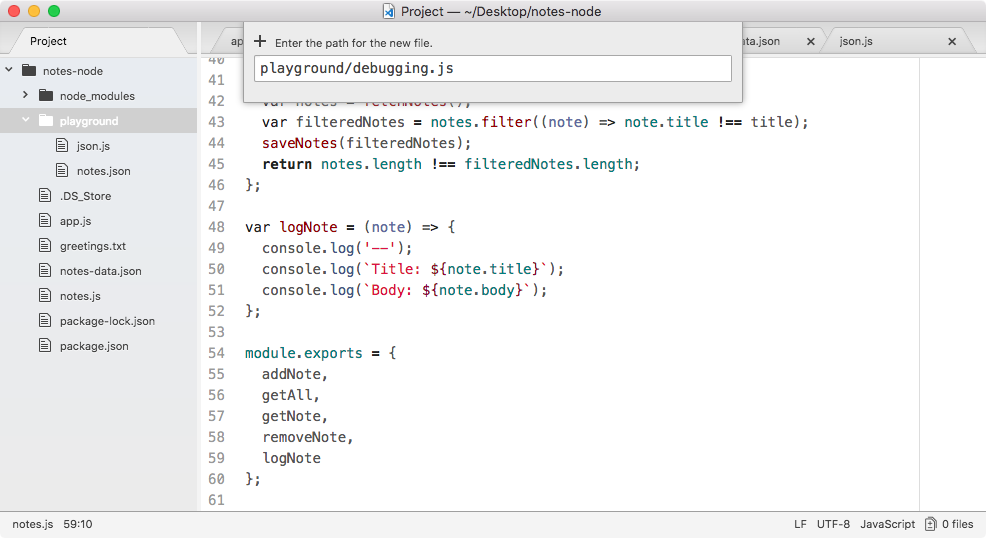
Before going ahead, we will learn that we do need to create a place to play around with debugging and that's going to happen in a playground file, since the code we're going to write is not going to be important to the notes app itself. Inside the notes app I'll make a new file called debugging.js:
In debugging.js we're going to start off with a basic example. We're going to make an object called person, and on that object for the moment, we're going to set one property name. Set it equal to your name, I'll set mine equal to the string Andrew as shown:
var person = {
  name: 'Andrew'
};
Next up we're going to set another property, but in the next line, person.age. I'll set mine equal to my age, 25:
var person = {
  name: 'Andrew'
};

person.age = 25;
Then we're going to add another statement that changes the name, person.name equals something like Mike:
var person = {
  name: 'Andrew'
};

person.age = 25;

person.name = 'Mike';
Finally, we're going to console.log the person object, the code is going to look like this:
var person = {
  name: 'Andrew'
};

person.age = 25;

person.name = 'Mike';

console.log(person);
Now, we actually already have a form of debugging in this example, we have a console.log statement.
As you're going through the Node application development process, you may or may not have used console.log to debug your app. Maybe something's not working as expected and you want to figure out exactly what that variable has stored inside of it. For example, if you have a function that solves a math problem, maybe at one part in the function the equation is wrong and you're getting a different result.
Using console.log can be a pretty great way to do that, but it's super limited. We can view that by running it from Terminal, I'll run the following command for this:
node playground/debugging.js
When I run the file, I do get my object printed out to the screen, which is great, but, as you know, if you want to debug something besides the person object you have to add another console.log statement in order to do that.
Imagine you have something like our app.js file, you want to see what command equals, then you want to see what argv equals, it could take a lot of time to add and remove those console.log statements. There is a better way to debug. This is using the Node debugger. Now, before we make any changes to the project, we'll take a look at how the debugger works inside of Terminal, and as I warned you in the beginning of the section, the built-in Node debugger, while it is effective, is a little ugly and hard to use.
For now, though, we are going to run the app much the same way, only this time we're going to type node inspect. Node debug is going to run our app completely differently from the regular Node command. We're running the same file in the playground folder, it's called debugging.js:
node inspect playground/debugging.js
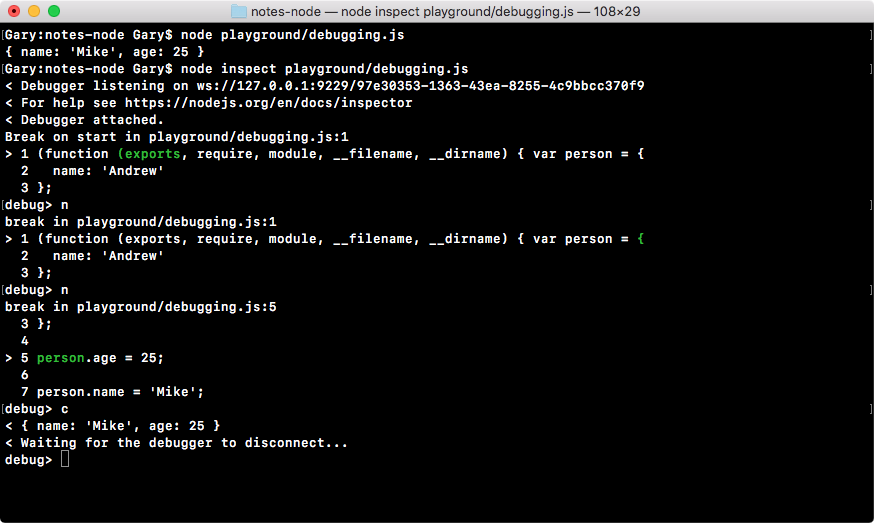
When you hit enter, you should see something like this:
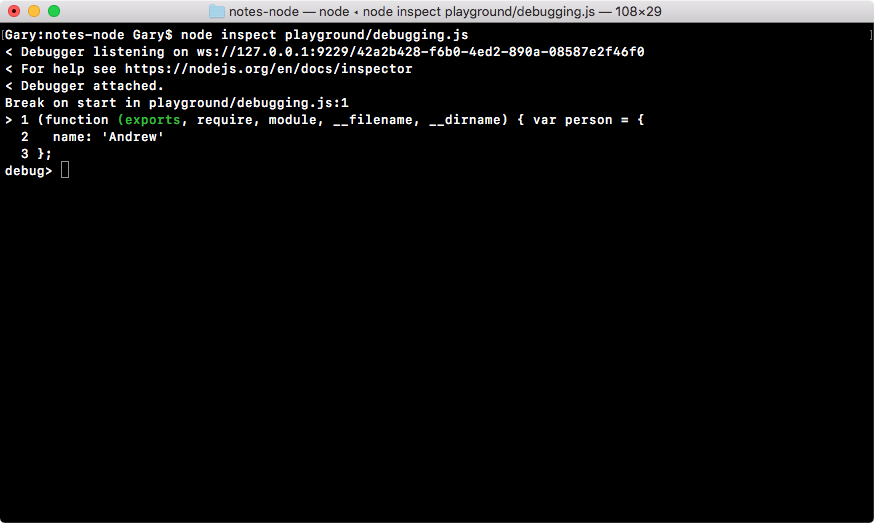
In the output, we can ignore the first two lines. This essentially means that the debugger was set up correctly and it's able to listen to the app running in the background.
Next, we have our very first line break in playground debugging on line one, and right following to it you can see line one with a little caret (>) next to it. When you first run your app in debug mode, it pauses before it executes the first statement. When we're paused on a line like line one, that means the line has not executed, so at this point in time we don't even have the person variable in place.
Now, as you can see in the preceding code, we haven't returned to the command line, Node is still waiting for input, and there are a few different commands we can run. For example, we can run n, which is short for next. You can type n, hit enter, and this moves on to the next statement.
The next statement we have, the statement on line one, was executed, so the person variable does exist. Then I can use n again to go to the next statement where we declare the person.name property, updating it from Andrew to Mike:
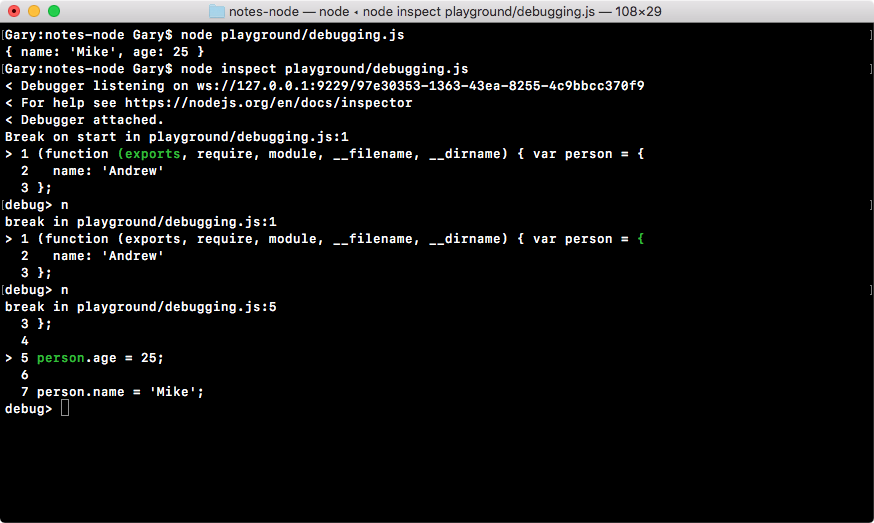
Notice, at this point, age does exist because that line has already been executed.
Now, the n command goes statement by statement through your entire program. If you realize that you don't want to do that through the whole program, which could take a lot of time, you can use c. The c command is short for Continue, and that continues to the very end of the program. In the following code, you can see our console.log statement runs the name Mike and the age 25:
This is that's a quick example of how to use the debug keyword.
Now, we actually didn't do any debugging, we just ran through the program since it is a little foreign in terms of writing these commands, such as next and continue, I decided to do a dry run once with no debugging. You can use control + C to quit the debugger and get returned back to Terminal.
I'll use clear to clear all the output. Now that we have a basic idea about how we can execute the program in debug mode, let's take a look at how we can actually do some debugging.