
What we'd like to do next is open up the developer tools, so we can explore exactly what happened when that request was made. Inside Chrome you can get to the Developer Tools using Settings| More Tools| Developer Tools:
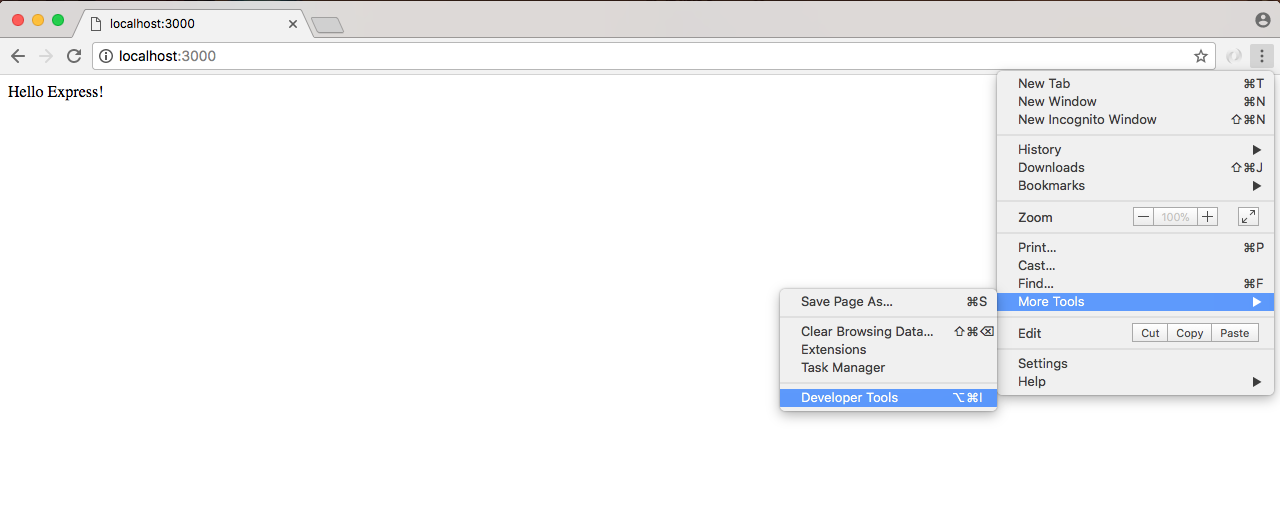
Or you can use the keyboard shortcut shown along with Developer Tools for the operating system.
We'll now open up the Developer Tools, which should look similar to the ones we used when we ran the Node Inspector debugger. They're a little different, but the idea is the same:
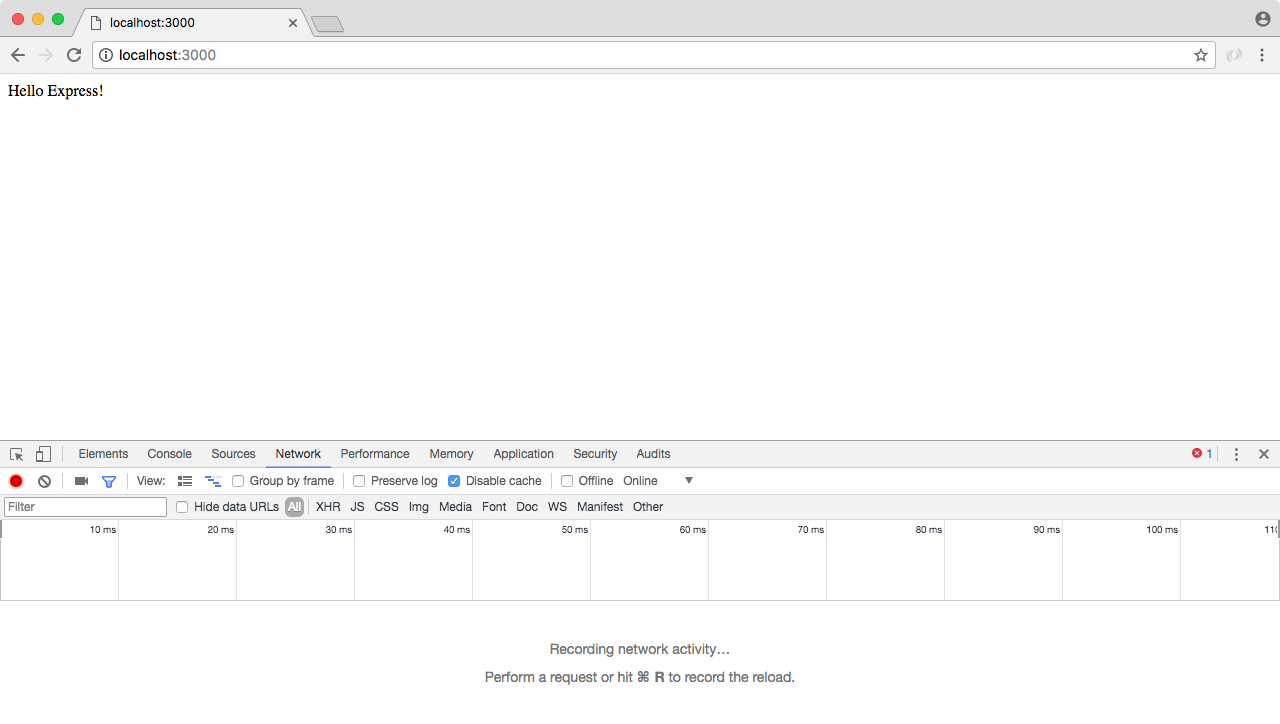
We have a bunch of tabs up top, and then we have our tab specific information down following on the page. In our case, we want to go to the Network tab, and currently we have nothing. So we'll refresh the page with the tab open, and what we see right here is our localhost request:
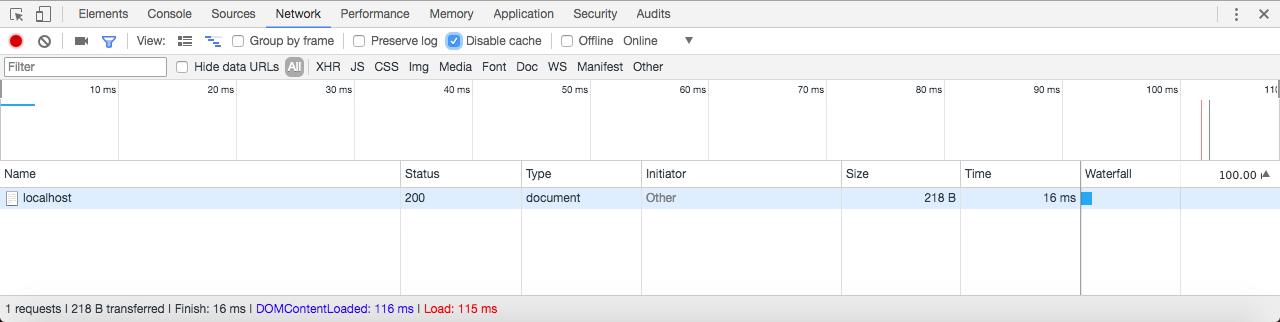
This is the request that's responsible for showing Hello Express! to the screen. We can actually click the request to view its details:
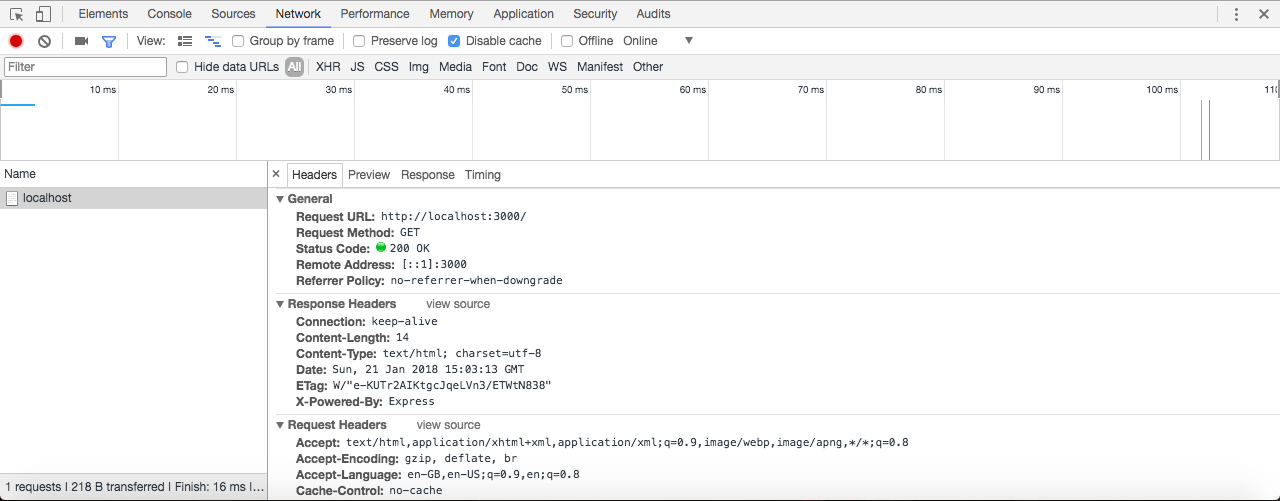
This page can be a little overwhelming at first. There is a a lot of information. Up on top we have some general info, such as the URL that was requested, the method that the client wanted; in this case, we made a GET request, and the status code that came back. The default status code being 200, meaning that everything went great. We'd like to point the attention to is one response header.
Under Response Headers we have a header called Content-Type. This header tells the client what type of data came back. Now this could be something like an HTML website, some text, or some JSON data and the client could be a web browser, an iPhone, an Android device, or any other computer with network capabilities. In our case, we're telling the browser that what came back is some HTML, so why don't you render it as such. We use the text/html Content-Type. And this automatically got set by Express, which is one of the reasons it's so popular. It handles a lot of that mundane stuff for us.