In GIS, statistics can be computed from both raster and vector data. However, even calculating raster statistics often involves some kind of vector data. For example, we would like to include some statistical indices in our assessment regarding the suitable areas. More precisely, we would like to include at least the minimum, maximum, and average slope, the minimum, maximum, and average suitability, the average distance from the mass point of the settlements, and the minimum distance from waters. For this task, we cannot use our rasters alone; we need to calculate indices from them only where they overlap with our suitable areas. For this, we need our suitable areas as polygons, and then we can leave the rest of the work to QGIS.
In order to get our suitable areas as polygons, we need to delimit them on our suitability layer. The most trivial first choice is to select every cell with an excellent rating. However, how many cells do we have with more than 75% suitability? If we have only a few, vectorizing them would make no sense, as every resulting polygon would fail the minimum area criterion. Furthermore, if we have some sites meeting the 1.5 km2 criterion, but the main roads go right through them, that is also a failure, as we cannot have a single site divided by a high traffic road.
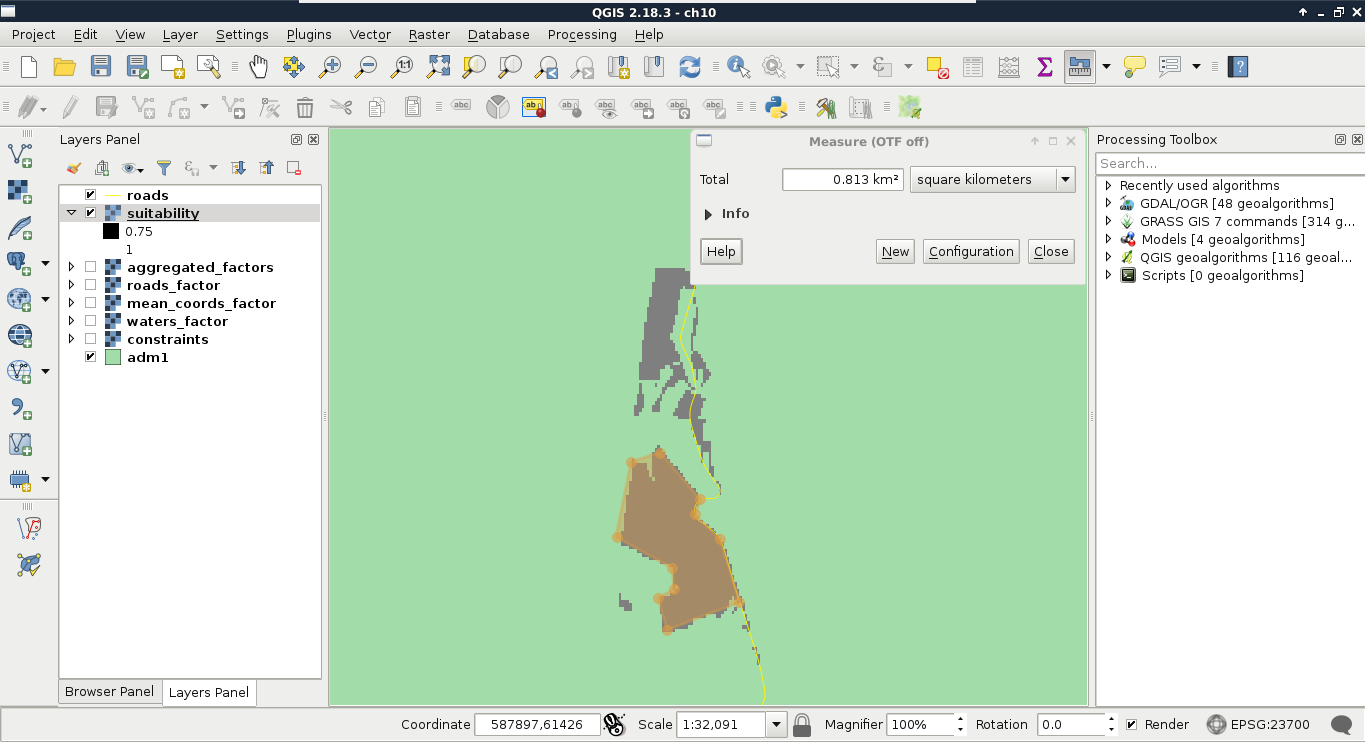
In order to get the minimum suitability value that our analysis is viable with, we can limit the suitability layer to a range. Let's open Properties | Style, and choose Singleband gray for Render type. Now we can manually input the range we would like to check (0.75 as Min and 1 as Max first), and set Contrast enhancement to Clip to MinMax. This way, QGIS simply does not render cells outside of the provided range. By using this representation model, we only have to load the roads layer, and measure some of the visualized patches. We can measure an area with the Measure Area tool from the main toolbar. We have to select it manually by clicking on the arrow next to Measure Line, and choosing it. The tool works like the regular polygon drawing tool--a left-click adds a new vertex, while a right-click closes the polygon: