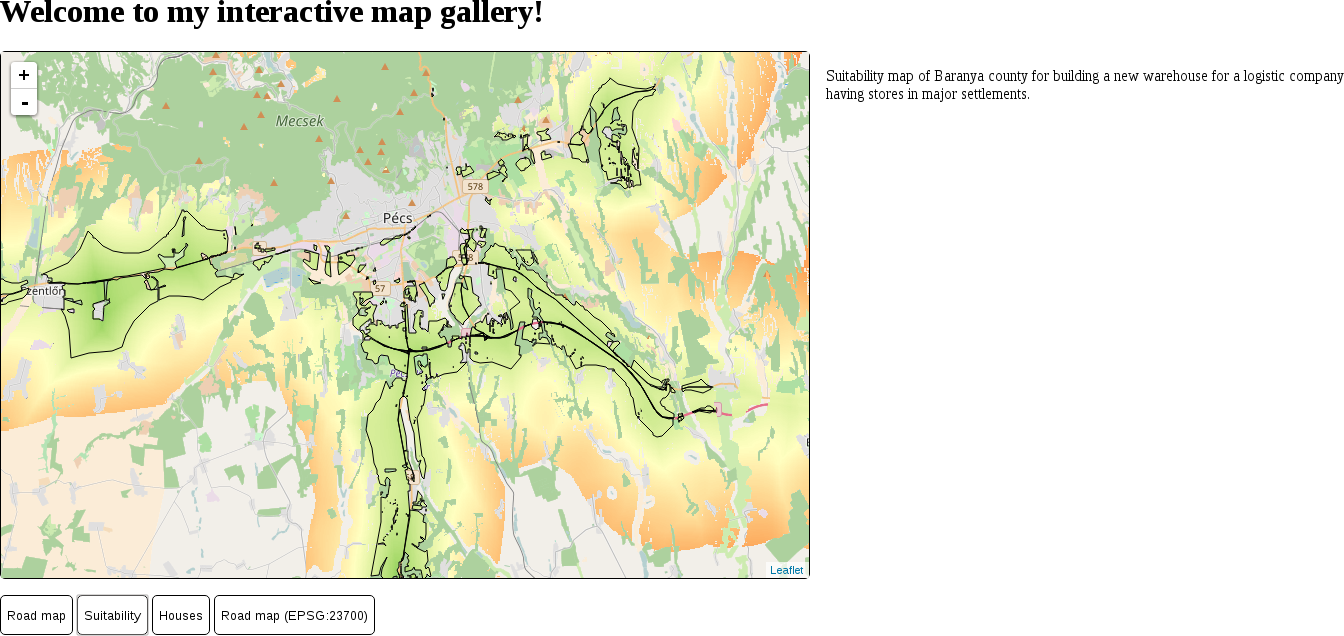
As we can see, Leaflet represents vector points with marker images, while it draws lines and polygons just like QGIS does. The next thing we should learn is how we can customize the styles of the vector features we display in our web maps. Both the L.wfs and L.geoJson.ajax functions accept additional styling parameters we provide. Styling is done by passing a style object to the vector layer's function containing supported styling parameters. The complete list of parameters can be seen on the base vector class's API documentation page: http://leafletjs.com/reference-1.0.3.html#path. Using the properties in the provided list, let's change our polygons to better match the suitability maps we created in QGIS:
- Edit the map.js file.
- Extend the parameters of the L.wfs function with a style object. It should contain a stroke property with the stroke's color, a weight property with the stroke's width in pixels, and a fillOpacity property with a zero value:
        L.wfs({
          url: 'http://localhost:8080/geoserver/ows',
          typeNS: 'practical_gis',
          typeName: 'suitable',
          geometryField: 'the_geom',
          style: {
            fillOpacity: 0,
            color: '#000000',
            weight: 1
          }
        }).addTo(map);
By opening our sustainability map again, we should be able to see our new polygons:
Customizing a single symbol for every vector feature in a layer is very easy in Leaflet. However, sometimes we would like to add thematics to our maps, such as attribute-based symbology. The style parameter of vector layers can aid us in this, as it also accepts a function. The function needs to be able to evaluate the style for every feature and return it in the end. Let's create a style for our houses map that visualizes our houses according to their prices:
- Based on the price range we used in QGIS, define some intervals. For me, the ranges are 0-10,000,000; 10,000,000-30,000,000, and 30,000,000+.
- Supply a style function to the L.geoJson.ajax call in the optional object parameter. The property name is style, as usual. Style functions accept one parameter in Leaflet, the currently processed feature:
        L.geoJson.ajax('houses.geojson', {
         style: function(feature) {

         }
        }).addTo(map);
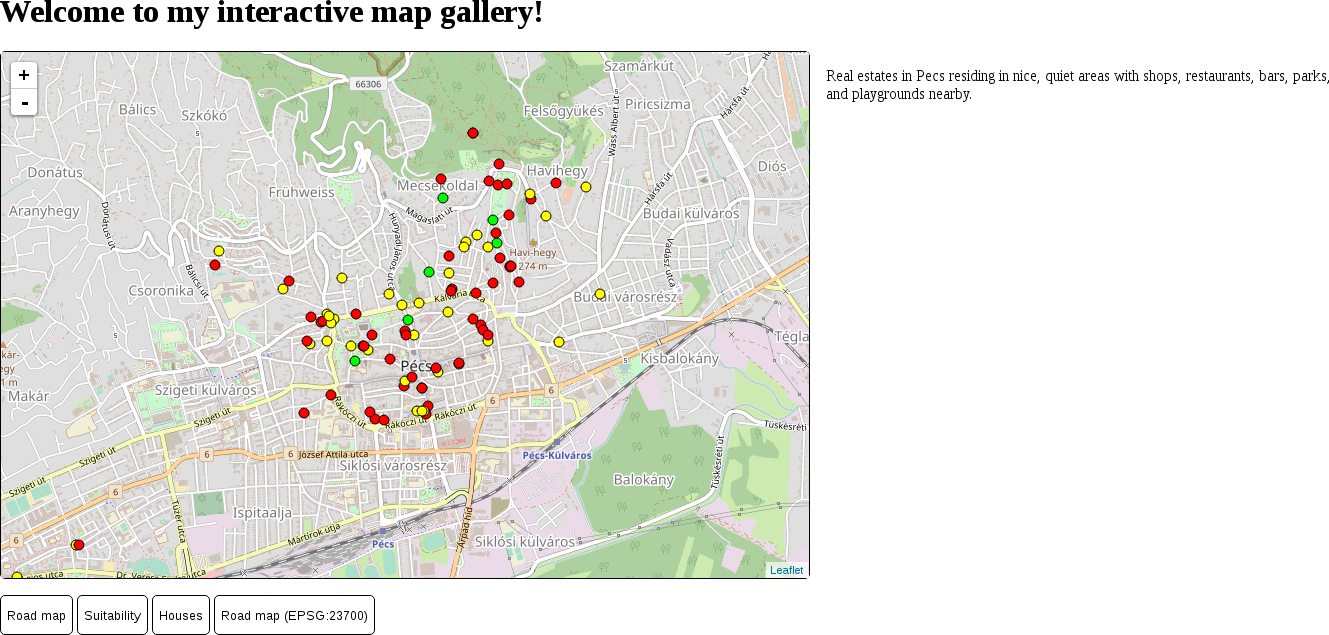
- In the style function, we should have only one variable: the fill color. Let's use three colors for our intervals--green, yellow, and red. Initialize a fill variable with the green color in the style function:
var fill = '#00ff00';
- We can override this color using conditional statements and checking the price attribute of the features against reference values. The easiest way is by checking whether the price is higher than the second interval's lower limit and then checking whether it's higher than the third interval's lower limit. The attributes of a feature can be accessed from its properties attribute, where they are stored in a simple object:
        if (feature.properties.price > 10000000) {
         fill = '#ffff00';
        }
        if (feature.properties.price > 30000000) {
         fill = '#ff0000';
        }
- The next step is to create a style object and saving it in a variable. This is the style object that is returned by our function, and should contain every rule we would like to apply:
        var styleObject = {
         radius: 5,
         fillColor: fill,
         color: '#000000',
         weight: 1,
         fillOpacity: 1
        };
- Finally, we should return the style object to Leaflet. We can define the return value of a function with the return keyword:
return styleObject;
If we reload our houses layer, it still contains the usual blue markers. The problem is that vector points are visualized as marker images, and marker images cannot be styled as vector features. We have to override this default behavior of Leaflet and visualize our vector points as circles. There are two functions we can use for this. The pointToLayer property can be supplied on point layers to specify how Leaflet should draw the vector point. It has to be a function with two parameters: feature and coordinates. The coordinates parameter passes the WGS 84 coordinates of the processed point directly; therefore, we can easily create another symbol from them. The function must return the vector object that can be directly used by Leaflet to draw our point. We can create a stylable circle with the L.circleMarker function, which only requires two WGS 84 coordinates.
- Provide a new property to L.geoJson.ajax besides style. Its name must be pointToLayer, while its value must be a function with two parameters. The parameter names are not fixed, but their order is:
        pointToLayer: function(feature, coords) {

        }
- In the function, simply return the result of an L.circleMarker function called directly with the coordinates parameter:
return L.circleMarker(coords);
The initialization call of our GeoJSON layer now should look like the following:
        L.geoJson.ajax('houses.geojson', {
          style: function(feature) {
            var fill = '#00ff00';
            if (feature.properties.price > 10000000) {
              fill = '#ffff00';
            }
            if (feature.properties.price > 30000000) {
              fill = '#ff0000';
            }
            var styleObject = {
              radius: 5,
              fillColor: fill,
              color: '#000000',
              weight: 1,
              fillOpacity: 1
            };
            return styleObject;
          },
          pointToLayer: function(feature, coords) {
            return L.circleMarker(coords);
          }
        }).addTo(map);
We can inspect our new thematic house map by refreshing the page and loading the map: