
Now that we have all of our factors set up, we only need to create a single factor map out of them. We could simply overlay them, and calculate their intersection for a restrictive, or their union for a permissive suitability. However, we can also consider them as components of a composite map, and calculate their average as follows:
- Open a raster calculator, and calculate the factors' average by adding them together, and dividing the result by the number of components. Save the result as a GeoTIFF file:
        ("mean_coords_factor@1" + "roads_factor@1" +
         "waters_factor@1") / 3
The result should be a beautiful, continuous raster map showing our factors:
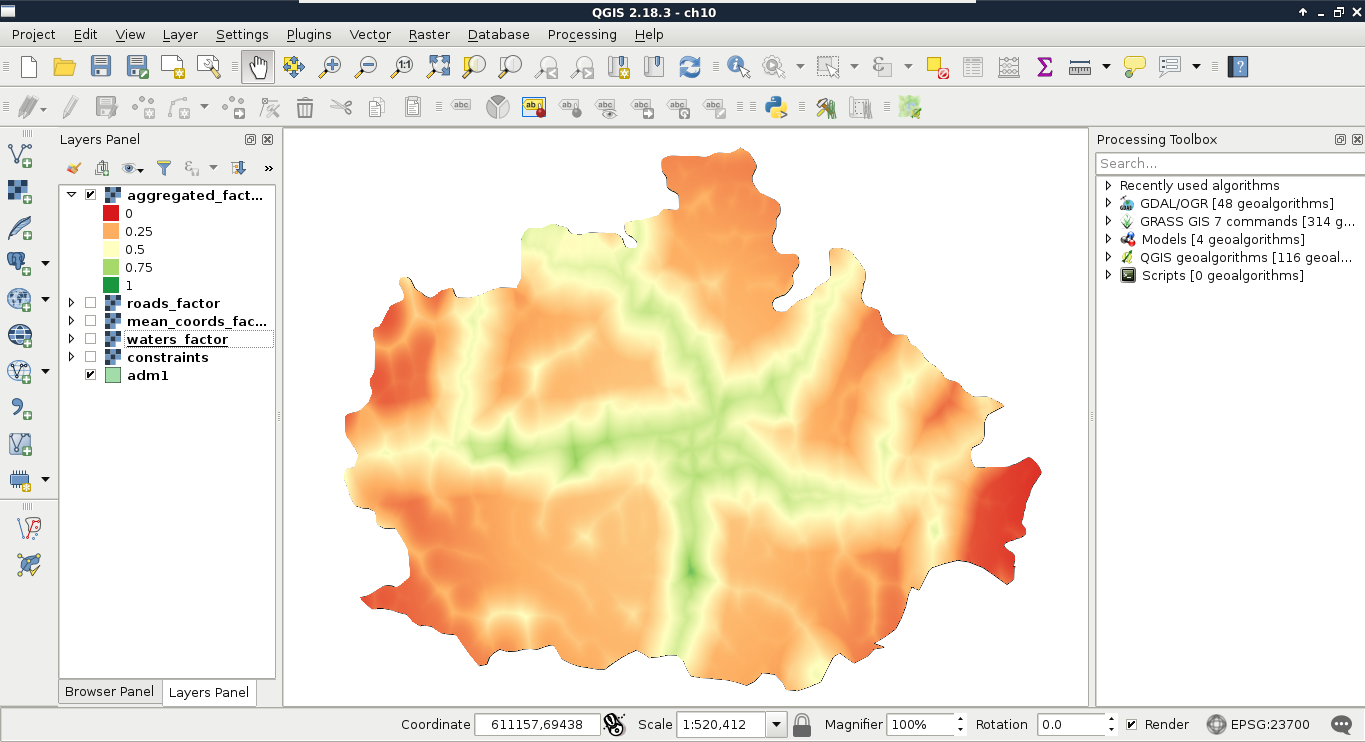
What is the problem with this approach? Some of our factors also contain constraints as zero values. By involving them in the calculation, the other two factors with higher suitability values can compensate those constrained cells. To get correct results, we have to manually handle the zero values in the roads and waters factor layers.
- Open a raster calculator, and overwrite the aggregated factors with an expression handling zero values in the roads and waters factor layers. Make sure to save it as a GeoTIFF file.
        ("roads_factor@1" > 0 AND "waters_factor@1" > 0) *
         ("mean_coords_factor@1" + "roads_factor@1" +
          "waters_factor@1") / 3
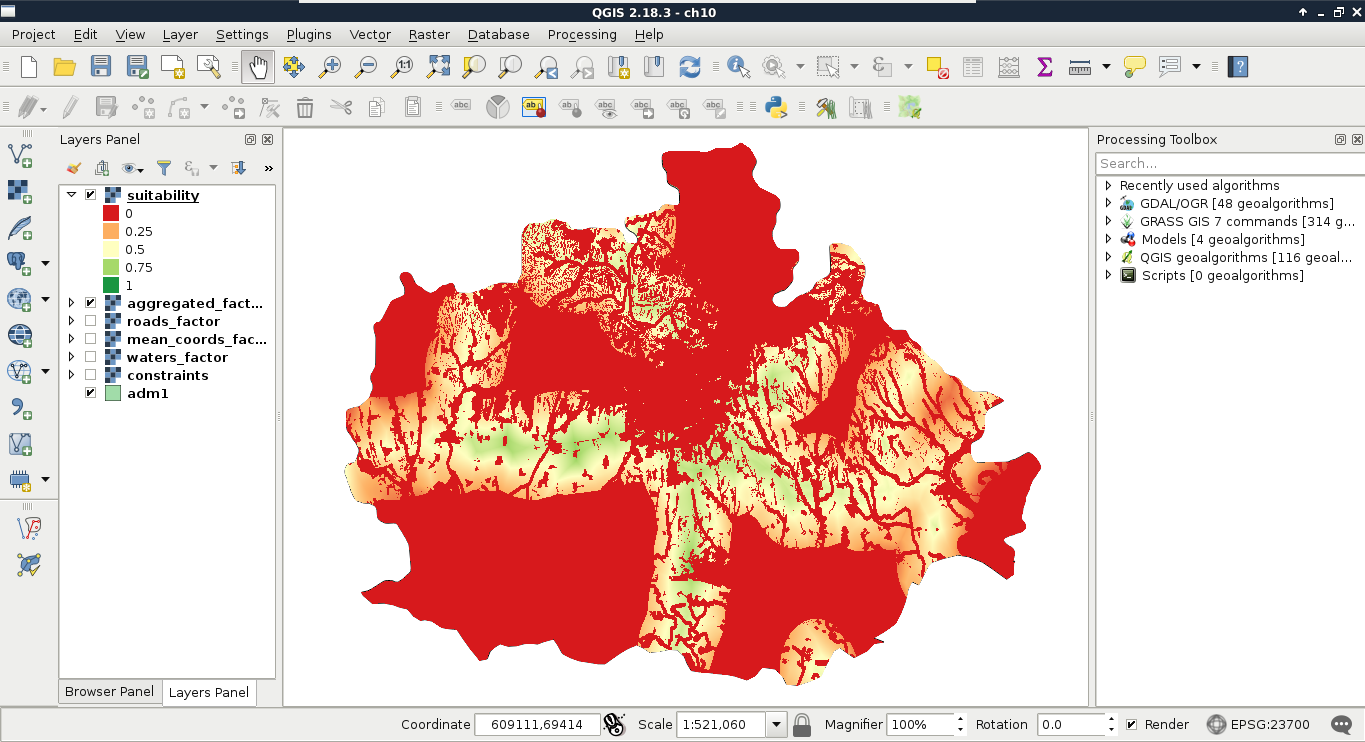
Now we have a less beautiful, but correct result. The only thing left to do is to simply overlay the constraints map with the aggregated factors, which is done using the following expression:
"aggregated_factors@1" * "constraints@1"
When the raster calculator is finished, we should be able to see our final suitability map:
The final step is to defuzzify the final map to get crisp data that we can evaluate. This step is very simple in GIS, as the MCE is usually done in such a way that we can get percentage values if we multiply the fuzzy values by 100. As this is a very trivial operation, we do not even have to calculate the percentage map, only label the actual intervals:
| Value | Label | Suitability |
| 0-0.25 | 0-25% | Poor |
| 0.25-0.5 | 25-50% | Weak |
| 0.5-0.75 | 50-75% | Moderate |
| 0.75-1 | 75-100% | Excellent |