Table of Contents for
Practical Malware Analysis
 Practical Malware Analysis
Published by
No Starch Press, 2012
Practical Malware Analysis
Published by
No Starch Press, 2012
- Cover
- Practical Malware Analysis: The Hands-On Guide to Dissecting Malicious Software
- Praise for Practical Malware Analysis
- Warning
- About the Authors
- About the Technical Reviewer
- About the Contributing Authors
- Foreword
- Acknowledgments
- Individual Thanks
- Introduction
- What Is Malware Analysis?
- Prerequisites
- Practical, Hands-On Learning
- What’s in the Book?
- 0. Malware Analysis Primer
- The Goals of Malware Analysis
- Malware Analysis Techniques
- Types of Malware
- General Rules for Malware Analysis
- I. Basic Analysis
- 1. Basic Static Techniques
- Antivirus Scanning: A Useful First Step
- Hashing: A Fingerprint for Malware
- Finding Strings
- Packed and Obfuscated Malware
- Portable Executable File Format
- Linked Libraries and Functions
- Static Analysis in Practice
- The PE File Headers and Sections
- Conclusion
- Labs
- 2. Malware Analysis in Virtual Machines
- The Structure of a Virtual Machine
- Creating Your Malware Analysis Machine
- Using Your Malware Analysis Machine
- The Risks of Using VMware for Malware Analysis
- Record/Replay: Running Your Computer in Reverse
- Conclusion
- 3. Basic Dynamic Analysis
- Sandboxes: The Quick-and-Dirty Approach
- Running Malware
- Monitoring with Process Monitor
- Viewing Processes with Process Explorer
- Comparing Registry Snapshots with Regshot
- Faking a Network
- Packet Sniffing with Wireshark
- Using INetSim
- Basic Dynamic Tools in Practice
- Conclusion
- Labs
- II. Advanced Static Analysis
- 4. A Crash Course in x86 Disassembly
- Levels of Abstraction
- Reverse-Engineering
- The x86 Architecture
- Conclusion
- 5. IDA Pro
- Loading an Executable
- The IDA Pro Interface
- Using Cross-References
- Analyzing Functions
- Using Graphing Options
- Enhancing Disassembly
- Extending IDA with Plug-ins
- Conclusion
- Labs
- 6. Recognizing C Code Constructs in Assembly
- Global vs. Local Variables
- Disassembling Arithmetic Operations
- Recognizing if Statements
- Recognizing Loops
- Understanding Function Call Conventions
- Analyzing switch Statements
- Disassembling Arrays
- Identifying Structs
- Analyzing Linked List Traversal
- Conclusion
- Labs
- 7. Analyzing Malicious Windows Programs
- The Windows API
- The Windows Registry
- Networking APIs
- Following Running Malware
- Kernel vs. User Mode
- The Native API
- Conclusion
- Labs
- III. Advanced Dynamic Analysis
- 8. Debugging
- Source-Level vs. Assembly-Level Debuggers
- Kernel vs. User-Mode Debugging
- Using a Debugger
- Exceptions
- Modifying Execution with a Debugger
- Modifying Program Execution in Practice
- Conclusion
- 9. OllyDbg
- Loading Malware
- The OllyDbg Interface
- Memory Map
- Viewing Threads and Stacks
- Executing Code
- Breakpoints
- Loading DLLs
- Tracing
- Exception Handling
- Patching
- Analyzing Shellcode
- Assistance Features
- Plug-ins
- Scriptable Debugging
- Conclusion
- Labs
- 10. Kernel Debugging with WinDbg
- Drivers and Kernel Code
- Setting Up Kernel Debugging
- Using WinDbg
- Microsoft Symbols
- Kernel Debugging in Practice
- Rootkits
- Loading Drivers
- Kernel Issues for Windows Vista, Windows 7, and x64 Versions
- Conclusion
- Labs
- IV. Malware Functionality
- 11. Malware Behavior
- Downloaders and Launchers
- Backdoors
- Credential Stealers
- Persistence Mechanisms
- Privilege Escalation
- Covering Its Tracks—User-Mode Rootkits
- Conclusion
- Labs
- 12. Covert Malware Launching
- Launchers
- Process Injection
- Process Replacement
- Hook Injection
- Detours
- APC Injection
- Conclusion
- Labs
- 13. Data Encoding
- The Goal of Analyzing Encoding Algorithms
- Simple Ciphers
- Common Cryptographic Algorithms
- Custom Encoding
- Decoding
- Conclusion
- Labs
- 14. Malware-Focused Network Signatures
- Network Countermeasures
- Safely Investigate an Attacker Online
- Content-Based Network Countermeasures
- Combining Dynamic and Static Analysis Techniques
- Understanding the Attacker’s Perspective
- Conclusion
- Labs
- V. Anti-Reverse-Engineering
- 15. Anti-Disassembly
- Understanding Anti-Disassembly
- Defeating Disassembly Algorithms
- Anti-Disassembly Techniques
- Obscuring Flow Control
- Thwarting Stack-Frame Analysis
- Conclusion
- Labs
- 16. Anti-Debugging
- Windows Debugger Detection
- Identifying Debugger Behavior
- Interfering with Debugger Functionality
- Debugger Vulnerabilities
- Conclusion
- Labs
- 17. Anti-Virtual Machine Techniques
- VMware Artifacts
- Vulnerable Instructions
- Tweaking Settings
- Escaping the Virtual Machine
- Conclusion
- Labs
- 18. Packers and Unpacking
- Packer Anatomy
- Identifying Packed Programs
- Unpacking Options
- Automated Unpacking
- Manual Unpacking
- Tips and Tricks for Common Packers
- Analyzing Without Fully Unpacking
- Packed DLLs
- Conclusion
- Labs
- VI. Special Topics
- 19. Shellcode Analysis
- Loading Shellcode for Analysis
- Position-Independent Code
- Identifying Execution Location
- Manual Symbol Resolution
- A Full Hello World Example
- Shellcode Encodings
- NOP Sleds
- Finding Shellcode
- Conclusion
- Labs
- 20. C++ Analysis
- Object-Oriented Programming
- Virtual vs. Nonvirtual Functions
- Creating and Destroying Objects
- Conclusion
- Labs
- 21. 64-Bit Malware
- Why 64-Bit Malware?
- Differences in x64 Architecture
- Windows 32-Bit on Windows 64-Bit
- 64-Bit Hints at Malware Functionality
- Conclusion
- Labs
- A. Important Windows Functions
- B. Tools for Malware Analysis
- C. Solutions to Labs
- Lab 1-1 Solutions
- Lab 1-2 Solutions
- Lab 1-3 Solutions
- Lab 1-4 Solutions
- Lab 3-1 Solutions
- Lab 3-2 Solutions
- Lab 3-3 Solutions
- Lab 3-4 Solutions
- Lab 5-1 Solutions
- Lab 6-1 Solutions
- Lab 6-2 Solutions
- Lab 6-3 Solutions
- Lab 6-4 Solutions
- Lab 7-1 Solutions
- Lab 7-2 Solutions
- Lab 7-3 Solutions
- Lab 9-1 Solutions
- Lab 9-2 Solutions
- Lab 9-3 Solutions
- Lab 10-1 Solutions
- Lab 10-2 Solutions
- Lab 10-3 Solutions
- Lab 11-1 Solutions
- Lab 11-2 Solutions
- Lab 11-3 Solutions
- Lab 12-1 Solutions
- Lab 12-2 Solutions
- Lab 12-3 Solutions
- Lab 12-4 Solutions
- Lab 13-1 Solutions
- Lab 13-2 Solutions
- Lab 13-3 Solutions
- Lab 14-1 Solutions
- Lab 14-2 Solutions
- Lab 14-3 Solutions
- Lab 15-1 Solutions
- Lab 15-2 Solutions
- Lab 15-3 Solutions
- Lab 16-1 Solutions
- Lab 16-2 Solutions
- Lab 16-3 Solutions
- Lab 17-1 Solutions
- Lab 17-2 Solutions
- Lab 17-3 Solutions
- Lab 18-1 Solutions
- Lab 18-2 Solutions
- Lab 18-3 Solutions
- Lab 18-4 Solutions
- Lab 18-5 Solutions
- Lab 19-1 Solutions
- Lab 19-2 Solutions
- Lab 19-3 Solutions
- Lab 20-1 Solutions
- Lab 20-2 Solutions
- Lab 20-3 Solutions
- Lab 21-1 Solutions
- Lab 21-2 Solutions
- Index
- Index
- Index
- Index
- Index
- Index
- Index
- Index
- Index
- Index
- Index
- Index
- Index
- Index
- Index
- Index
- Index
- Index
- Index
- Index
- Index
- Index
- Index
- Index
- Index
- Index
- Index
- Updates
- About the Authors
- Copyright
Malware can use several techniques to interfere with normal debugger operation: thread local storage (TLS) callbacks, exceptions, and interrupt insertion. These techniques try to disrupt the program’s execution only if it is under the control of a debugger.
You might think that when you load a program into a debugger, it will pause at the first instruction the program executes, but this is not always the case. Most debuggers start at the program’s entry point as defined by the PE header. A TLS callback can be used to execute code before the entry point and therefore execute secretly in a debugger. If you rely only on the use of a debugger, you could miss certain malware functionality, as the TLS callback can run as soon as it is loaded into the debugger.
TLS is a Windows storage class in which a data object is not an automatic stack variable, yet
is local to each thread that runs the code. Basically, TLS allows each thread to maintain a
different value for a variable declared using TLS. When TLS is implemented by an executable, the code will typically contain a
.tls section in the PE header, as shown in Figure 16-1. TLS supports callback functions for
initialization and termination of TLS data objects. Windows executes these functions before running
code at the normal start of a program.
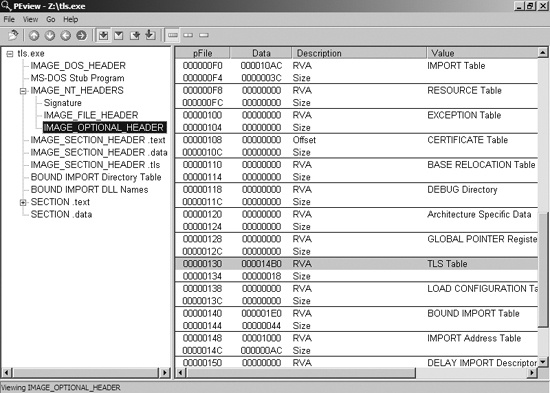
TLS callbacks can be discovered by viewing the .tls section
using PEview. You should immediately suspect anti-debugging if you see a .tls section, as normal programs typically do not use this section.
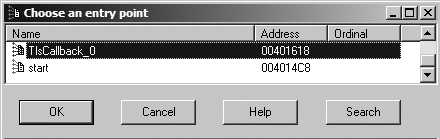
Analysis of TLS callbacks is easy with IDA Pro. Once IDA Pro has finished its analysis, you
can view the entry points for a binary by pressing CTRL-E to
display all entry points to the program, including TLS callbacks, as shown in Figure 16-2. All TLS callback functions have their labels
prepended with TlsCallback. You can browse to the callback
function in IDA Pro by double-clicking the function name.
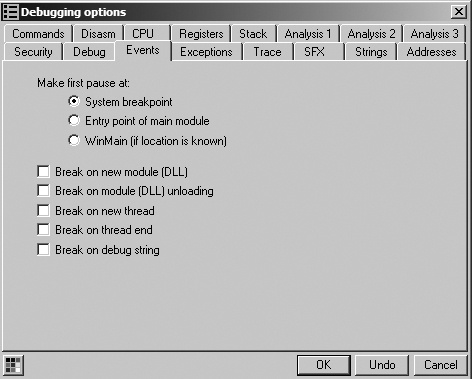
TLS callbacks can be handled within a debugger, though sometimes debuggers will run the TLS callback before breaking at the initial entry point. To avoid this problem, change the debugger’s settings. For example, if you’re using OllyDbg, you can have it pause before the TLS callback by selecting Options ▶ Debugging Options ▶ Events and setting System breakpoint as the place for the first pause, as shown in Figure 16-3.
Note
OllyDbg 2.0 has more breaking capabilities than version 1.1; for example, it can pause at the start of a TLS callback. Also, WinDbg always breaks at the system breakpoint before the TLS callbacks.
Because TLS callbacks are well known, malware uses them less frequently than in the past. Not
many legitimate applications use TLS callbacks, so a .tls section
in an executable can stand out.
As discussed earlier, interrupts generate exceptions that are used by the debugger to perform operations like breakpoints. In Chapter 15, you learned how to set up an SEH to achieve an unconventional jump. The modification of the SEH chain applies to both anti-disassembly and anti-debugging. In this section, we will skip the SEH specifics (since they were addressed in Chapter 15) and focus on other ways that exceptions can be used to hamper the malware analyst.
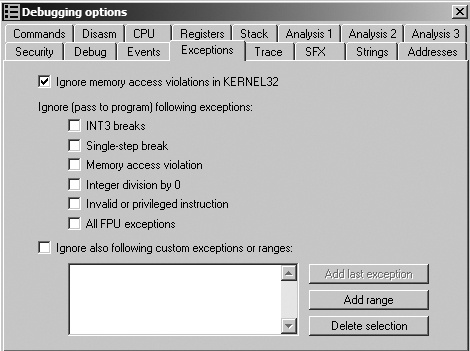
Exceptions can be used to disrupt or detect a debugger. Most exception-based detection relies on the fact that debuggers will trap the exception and not immediately pass it to the process being debugged for handling. The default setting on most debuggers is to trap exceptions and not pass them to the program. If the debugger doesn’t pass the exception to the process properly, that failure can be detected within the process exception-handling mechanism.
Figure 16-4 shows OllyDbg’s default settings; all exceptions will be trapped unless the box is checked. These options are accessed via Options ▶ Debugging Options ▶ Exceptions.
A classic form of anti-debugging is to use exceptions to annoy the analyst and disrupt normal program execution by inserting interrupts in the middle of a valid instruction sequence. Depending on the debugger settings, these insertions could cause the debugger to stop, since it is the same mechanism the debugger itself uses to set software breakpoints.
Because INT 3 is used by debuggers to set software
breakpoints, one anti-debugging technique consists of inserting 0xCC opcodes into valid sections of code in order to trick the debugger into thinking
that the opcodes are its breakpoints. Some debuggers track where they set software breakpoints in
order to avoid falling for this trick.
The 2-byte opcode sequence 0xCD03 can also be used to
generate an INT 3, and this is often a valid way for malware to
interfere with WinDbg. Outside a debugger, 0xCD03 generates a
STATUS_BREAKPOINT exception. However, inside WinDbg, it catches
the breakpoint and then silently advances EIP by exactly 1 byte, since a breakpoint is normally the
0xCC opcode. This can cause the program to execute a different
set of instructions when being debugged by WinDbg versus running normally. (OllyDbg is not
vulnerable to interference using this 2-byte INT 3
attack.)
Example 16-9 shows assembly code that implements this technique.
This example sets a new SEH and then calls INT 3 to force the
code to continue.
The INT 2D anti-debugging technique functions like INT 3—the INT 0x2D instruction is
used to access the kernel debugger. Because INT 0x2D is the way
that kernel debuggers set breakpoints, the method shown in Listing 16-9 applies.
One of Intel’s undocumented instructions is the In-Circuit Emulator (ICE) breakpoint,
icebp (opcode 0xF1). This
instruction is designed to make it easier to debug using an ICE, because it is difficult to set an
arbitrary breakpoint with an ICE.
Executing this instruction generates a single-step exception. If the program is being traced via single-stepping, the debugger will think it is the normal exception generated by the single-step and not execute a previously set exception handler. Malware can take advantage of this by using the exception handler for its normal execution flow, which would be disrupted in this case.
In order to bypass this technique, do not single-step over an icebp instruction.