Table of Contents for
Practical Malware Analysis
 Practical Malware Analysis
Published by
No Starch Press, 2012
Practical Malware Analysis
Published by
No Starch Press, 2012
- Cover
- Practical Malware Analysis: The Hands-On Guide to Dissecting Malicious Software
- Praise for Practical Malware Analysis
- Warning
- About the Authors
- About the Technical Reviewer
- About the Contributing Authors
- Foreword
- Acknowledgments
- Individual Thanks
- Introduction
- What Is Malware Analysis?
- Prerequisites
- Practical, Hands-On Learning
- What’s in the Book?
- 0. Malware Analysis Primer
- The Goals of Malware Analysis
- Malware Analysis Techniques
- Types of Malware
- General Rules for Malware Analysis
- I. Basic Analysis
- 1. Basic Static Techniques
- Antivirus Scanning: A Useful First Step
- Hashing: A Fingerprint for Malware
- Finding Strings
- Packed and Obfuscated Malware
- Portable Executable File Format
- Linked Libraries and Functions
- Static Analysis in Practice
- The PE File Headers and Sections
- Conclusion
- Labs
- 2. Malware Analysis in Virtual Machines
- The Structure of a Virtual Machine
- Creating Your Malware Analysis Machine
- Using Your Malware Analysis Machine
- The Risks of Using VMware for Malware Analysis
- Record/Replay: Running Your Computer in Reverse
- Conclusion
- 3. Basic Dynamic Analysis
- Sandboxes: The Quick-and-Dirty Approach
- Running Malware
- Monitoring with Process Monitor
- Viewing Processes with Process Explorer
- Comparing Registry Snapshots with Regshot
- Faking a Network
- Packet Sniffing with Wireshark
- Using INetSim
- Basic Dynamic Tools in Practice
- Conclusion
- Labs
- II. Advanced Static Analysis
- 4. A Crash Course in x86 Disassembly
- Levels of Abstraction
- Reverse-Engineering
- The x86 Architecture
- Conclusion
- 5. IDA Pro
- Loading an Executable
- The IDA Pro Interface
- Using Cross-References
- Analyzing Functions
- Using Graphing Options
- Enhancing Disassembly
- Extending IDA with Plug-ins
- Conclusion
- Labs
- 6. Recognizing C Code Constructs in Assembly
- Global vs. Local Variables
- Disassembling Arithmetic Operations
- Recognizing if Statements
- Recognizing Loops
- Understanding Function Call Conventions
- Analyzing switch Statements
- Disassembling Arrays
- Identifying Structs
- Analyzing Linked List Traversal
- Conclusion
- Labs
- 7. Analyzing Malicious Windows Programs
- The Windows API
- The Windows Registry
- Networking APIs
- Following Running Malware
- Kernel vs. User Mode
- The Native API
- Conclusion
- Labs
- III. Advanced Dynamic Analysis
- 8. Debugging
- Source-Level vs. Assembly-Level Debuggers
- Kernel vs. User-Mode Debugging
- Using a Debugger
- Exceptions
- Modifying Execution with a Debugger
- Modifying Program Execution in Practice
- Conclusion
- 9. OllyDbg
- Loading Malware
- The OllyDbg Interface
- Memory Map
- Viewing Threads and Stacks
- Executing Code
- Breakpoints
- Loading DLLs
- Tracing
- Exception Handling
- Patching
- Analyzing Shellcode
- Assistance Features
- Plug-ins
- Scriptable Debugging
- Conclusion
- Labs
- 10. Kernel Debugging with WinDbg
- Drivers and Kernel Code
- Setting Up Kernel Debugging
- Using WinDbg
- Microsoft Symbols
- Kernel Debugging in Practice
- Rootkits
- Loading Drivers
- Kernel Issues for Windows Vista, Windows 7, and x64 Versions
- Conclusion
- Labs
- IV. Malware Functionality
- 11. Malware Behavior
- Downloaders and Launchers
- Backdoors
- Credential Stealers
- Persistence Mechanisms
- Privilege Escalation
- Covering Its Tracks—User-Mode Rootkits
- Conclusion
- Labs
- 12. Covert Malware Launching
- Launchers
- Process Injection
- Process Replacement
- Hook Injection
- Detours
- APC Injection
- Conclusion
- Labs
- 13. Data Encoding
- The Goal of Analyzing Encoding Algorithms
- Simple Ciphers
- Common Cryptographic Algorithms
- Custom Encoding
- Decoding
- Conclusion
- Labs
- 14. Malware-Focused Network Signatures
- Network Countermeasures
- Safely Investigate an Attacker Online
- Content-Based Network Countermeasures
- Combining Dynamic and Static Analysis Techniques
- Understanding the Attacker’s Perspective
- Conclusion
- Labs
- V. Anti-Reverse-Engineering
- 15. Anti-Disassembly
- Understanding Anti-Disassembly
- Defeating Disassembly Algorithms
- Anti-Disassembly Techniques
- Obscuring Flow Control
- Thwarting Stack-Frame Analysis
- Conclusion
- Labs
- 16. Anti-Debugging
- Windows Debugger Detection
- Identifying Debugger Behavior
- Interfering with Debugger Functionality
- Debugger Vulnerabilities
- Conclusion
- Labs
- 17. Anti-Virtual Machine Techniques
- VMware Artifacts
- Vulnerable Instructions
- Tweaking Settings
- Escaping the Virtual Machine
- Conclusion
- Labs
- 18. Packers and Unpacking
- Packer Anatomy
- Identifying Packed Programs
- Unpacking Options
- Automated Unpacking
- Manual Unpacking
- Tips and Tricks for Common Packers
- Analyzing Without Fully Unpacking
- Packed DLLs
- Conclusion
- Labs
- VI. Special Topics
- 19. Shellcode Analysis
- Loading Shellcode for Analysis
- Position-Independent Code
- Identifying Execution Location
- Manual Symbol Resolution
- A Full Hello World Example
- Shellcode Encodings
- NOP Sleds
- Finding Shellcode
- Conclusion
- Labs
- 20. C++ Analysis
- Object-Oriented Programming
- Virtual vs. Nonvirtual Functions
- Creating and Destroying Objects
- Conclusion
- Labs
- 21. 64-Bit Malware
- Why 64-Bit Malware?
- Differences in x64 Architecture
- Windows 32-Bit on Windows 64-Bit
- 64-Bit Hints at Malware Functionality
- Conclusion
- Labs
- A. Important Windows Functions
- B. Tools for Malware Analysis
- C. Solutions to Labs
- Lab 1-1 Solutions
- Lab 1-2 Solutions
- Lab 1-3 Solutions
- Lab 1-4 Solutions
- Lab 3-1 Solutions
- Lab 3-2 Solutions
- Lab 3-3 Solutions
- Lab 3-4 Solutions
- Lab 5-1 Solutions
- Lab 6-1 Solutions
- Lab 6-2 Solutions
- Lab 6-3 Solutions
- Lab 6-4 Solutions
- Lab 7-1 Solutions
- Lab 7-2 Solutions
- Lab 7-3 Solutions
- Lab 9-1 Solutions
- Lab 9-2 Solutions
- Lab 9-3 Solutions
- Lab 10-1 Solutions
- Lab 10-2 Solutions
- Lab 10-3 Solutions
- Lab 11-1 Solutions
- Lab 11-2 Solutions
- Lab 11-3 Solutions
- Lab 12-1 Solutions
- Lab 12-2 Solutions
- Lab 12-3 Solutions
- Lab 12-4 Solutions
- Lab 13-1 Solutions
- Lab 13-2 Solutions
- Lab 13-3 Solutions
- Lab 14-1 Solutions
- Lab 14-2 Solutions
- Lab 14-3 Solutions
- Lab 15-1 Solutions
- Lab 15-2 Solutions
- Lab 15-3 Solutions
- Lab 16-1 Solutions
- Lab 16-2 Solutions
- Lab 16-3 Solutions
- Lab 17-1 Solutions
- Lab 17-2 Solutions
- Lab 17-3 Solutions
- Lab 18-1 Solutions
- Lab 18-2 Solutions
- Lab 18-3 Solutions
- Lab 18-4 Solutions
- Lab 18-5 Solutions
- Lab 19-1 Solutions
- Lab 19-2 Solutions
- Lab 19-3 Solutions
- Lab 20-1 Solutions
- Lab 20-2 Solutions
- Lab 20-3 Solutions
- Lab 21-1 Solutions
- Lab 21-2 Solutions
- Index
- Index
- Index
- Index
- Index
- Index
- Index
- Index
- Index
- Index
- Index
- Index
- Index
- Index
- Index
- Index
- Index
- Index
- Index
- Index
- Index
- Index
- Index
- Index
- Index
- Index
- Index
- Updates
- About the Authors
- Copyright
The import for
gethostbynameis found at 0x100163CC in the.idatasection.The
gethostbynameimport is called nine times by five different functions throughout the malware.A DNS request for
pics.practicalmalwareanalysis.comwill be made by the malware if the call togethostbynameat 0x10001757 succeeds.IDA Pro has recognized 23 local variables for the function at 0x10001656.
IDA Pro has recognized one parameter for the function at 0x10001656.
The string
\cmd.exe /cis located at 0x10095B34.That area of code appears to be creating a remote shell session for the attacker.
The OS version is stored in the global variable
dword_1008E5C4.The registry values located at
HKLM\SOFTWARE\Microsoft\Windows\CurrentVersion\WorkTimeandWorkTimesare queried and sent over the remote shell connection.The
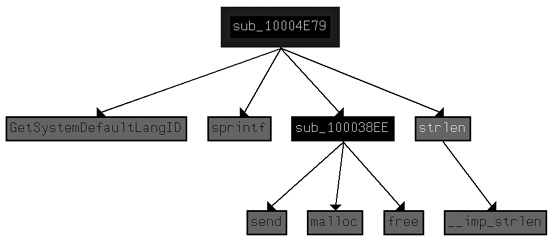
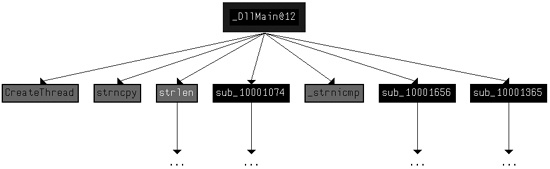
PSLISTexport sends a process listing across the network or finds a particular process name in the listing and gets information about it.GetSystemDefaultLangID,send, andsprintfare API calls made fromsub_10004E79. This function could be renamed to something useful likeGetSystemLanguage.DllMaincallsstrncpy,strnicmp,CreateThread, andstrlendirectly. At a depth of 2, it calls a variety of API calls, includingSleep,WinExec,gethostbyname, and many other networking function calls.The malware will sleep for 30 seconds.
The arguments are
6,1, and2.These arguments correspond to three symbolic constants:
IPPROTO_TCP,SOCK_STREAM, andAF_INET.The
ininstruction is used for virtual machine detection at 0x100061DB, and the 0x564D5868h corresponds to theVMXhstring. Using the cross-reference, we see the stringFound Virtual Machinein the caller function.Random data appears to exist at 0x1001D988.
If you run Lab05-01.py, the random data is unobfuscated to reveal a string.
By pressing the A key on the keyboard, we can turn this into the readable string:
xdoor is this backdoor, string decoded for Practical Malware AnalysisLab :)1234.The script works by XOR’ing 0x50 bytes of data with 0x55 and modifying the bytes in IDA Pro using
PatchByte.
Once we load the malicious DLL into IDA Pro, we are taken directly to DllMain at 0x1000D02E. (You may need to display line numbers in the graph
view by using Options ▸ General and checking Line Prefixes, or you can toggle
between the graph and traditional view by pressing the spacebar, which allows you to see the line
numbers without changing the options.) DllMain is where we want
to begin analysis, because all code that executes from the DllEntryPoint until DllMain has likely been generated
by the compiler, and we don’t want to get bogged down analyzing compiler-generated
code.
To answer questions 2 through 4, we begin by viewing the imports of this DLL, by selecting
View ▸ Open Subviews ▸ Imports. In this list, we find
gethostbyname and double-click it to see it in the disassembly.
The gethostbyname import resides at location 0x100163CC in the
.idata section of the binary.
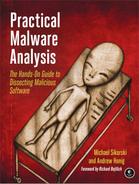
To see the number of functions that call gethostbyname, we
check its cross-references by pressing CTRL-X with the cursor on
gethostbyname, which brings up the window shown in Figure C-12. The text “Line 1 of 18” at the bottom of
the window tells us that there are nine cross-references for gethostbyname. Some versions of IDA Pro double-count cross-references: p is a reference because it is being called, and r is a reference because it is a “read” reference (since it is call dword ptr [...] for an import, the CPU must read the import and then
call into it). Examining the cross-reference list closely, you can see that gethostbyname is called by five separate functions.
We press G on the keyboard to quickly navigate to 0x10001757. Once at this location, we see
the following code, which calls gethostbyname.
1000174E         mov     eax, off_10019040
10001753         add     eax, 0Dh ❶
10001756         push    eax
10001757         call    ds:gethostbyname
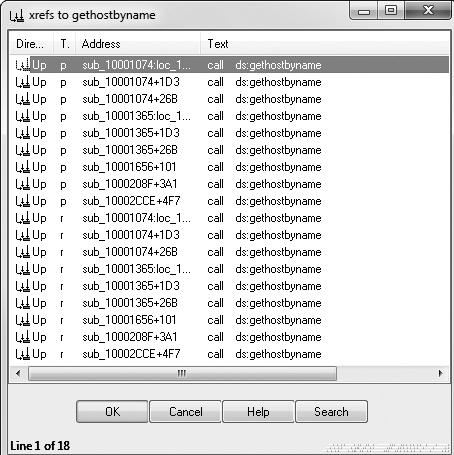
The gethostbyname method takes a single
parameter—typically, a string containing a domain name. Therefore, we need to work backward
and figure out what is in EAX when gethostbyname is called. It
appears that off_10019040 is moved into EAX. If we double-click
that offset, we see the string [This is
RDO]pics.practicalmalwareanalysis.com at that location.
As you can see at ❶, the pointer into the string
is advanced by 0xD bytes, which gets a pointer to the string pics.practicalmalwareanalysis.com in EAX for the call to gethostbyname. Figure C-13 shows the
string in memory, and how adding 0xD to EAX advances the pointer to the location of the URL in
memory. The call will perform a DNS request to get an IP address for the domain.
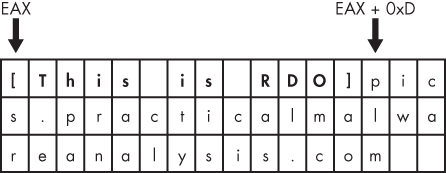
To answer questions 5 and 6, we press G on the keyboard to navigate to 0x10001656 in order to
analyze sub_10001656. In Figure C-14, we see what IDA Pro has done to recognize and
label the function’s local variables and parameters. The labeled local variables correspond to
negative offsets, and we count 23 of them, most of which are prepended with var_. The freeware version of IDA Pro counts only 20 local variables, so the version you
are using may detect a slightly different number of local variables. The parameters are labeled and
referenced with positive offsets, and we see that IDA Pro has recognized one parameter for the
function labeled arg_0.
To answer questions 7 through 10, we begin by viewing the strings for this DLL by
selecting View ▸ Open Subviews ▸ Strings. In this
list, double-click \cmd.exe /c to see it in the disassembly.
Notice that the string resides in the xdoors_d section of the PE
file at 0x10095B34. On checking the cross-references to this string, we see that there is only one
at 0x100101D0, where this string is pushed onto the stack.
Examining the graph view of this function shows a series of memcmp functions that are comparing strings such as cd, exit, install,
inject, and uptime. We also
see that the string reference earlier in the function at 0x1001009D contains the string This Remote Shell Session. Examining the function and the calls it makes
shows a series of calls to recv and send. Using these three pieces of evidence, we can guess that we are looking at a remote
shell session function.
The dword_1008E5C4 is a global variable that we can
double-click (at 0x100101C8) to show its location in memory at 0x1008E5C4, within the .data section of the DLL. Checking the cross-references by pressing
CTRL-X shows that it is
referenced three times, but only one reference modifies dword_1008E5C4. The following listing shows how dword_1008E5C4 is modified.
10001673        call    sub_10003695
10001678        mov     dword_1008E5C4, eax
We see that EAX is moved into dword_1008E5C4, and that EAX
is the return value from the function call made in the previous instruction. Therefore, we need to
determine what that function returns. To do so, we examine sub_10003695 by double-clicking it and looking at the disassembly. The sub_10003695 function contains a call to GetVersionEx, which obtains information about the current version of the OS, as shown in
the following listing.
100036AF        call    ds:GetVersionExA
100036B5        xor     eax, eax
100036B7        cmp     [ebp+VersionInformation.dwPlatformId], 2
100036BE        setz    al
The dwPlatformId is compared to the number 2 in order to
determine how to set the AL register. AL will be set if the PlatformId is VER_PLATFORM_WIN32_NT. This is just a
simple check to make sure that the OS is Windows 2000 or higher, and we can conclude that the global
variable will typically be set to 1.
As previously discussed, the remote shell function at 0x1000FF58 contains a series of memcmp functions starting at 0x1000FF58. At 0x10010452, we see the
memcmp with robotwork, as
follows:
10010444         push    9                       ; Size
10010446         lea     eax, [ebp+Dst]
1001044C         push    offset aRobotwork       ; "robotwork"
10010451         push    eax                     ; Buf1
10010452         call    memcmp
10010457         add     esp, 0Ch
1001045A         test    eax, eax
1001045C         jnz     short loc_10010468 ❶
1001045E         push    [ebp+s] ❸                ; s
10010461         call    sub_100052A2 ❷
The jnz at ❶ will not be taken if the string matches robotwork,
and the call at ❷ will be called. Examining sub_100052A2, we see that it queries the registry at HKLM\SOFTWARE\Microsoft\Windows\CurrentVersion\WorkTime and WorkTimes, and then returns this information over the network socket that
was passed to the function at ❸.
To answer question 11, we begin by viewing the exports for this DLL by selecting View ▸ Open Subviews ▸ Exports. We find PSLIST in this list and double-click it to move the cursor to 0x10007025,
the start of the export’s code. This function appears to take one of two paths, depending on
the result of sub_100036C3. The sub_100036C3 function checks to see if the OS version is Windows Vista/7 or XP/2003/2000.
Both code paths use CreateToolhelp32Snapshot to help them grab a
process listing, which we infer from the strings and API calls. Both code paths return the process
listing over the socket using send.
To answer questions 12 and 13, we graph a function’s cross-references by selecting
View ▸ Graphs ▸ Xrefs From when the cursor is on the
function name of interest. We go to sub_10004E79 by pressing G on
the keyboard and entering 0x10004E79.
Figure C-15 shows the result of graphing the
cross-references for sub_10004E79. We see that this function
calls GetSystemDefaultLangID and send. This information tells us that the function likely sends the language identifier
over a network socket, so we can right-click the function name and give it a more meaningful name,
such as send_languageID.
Note
Performing a quick analysis like this is an easy way to get a high-level overview of a binary. This approach is particularly handy when analyzing large binaries.
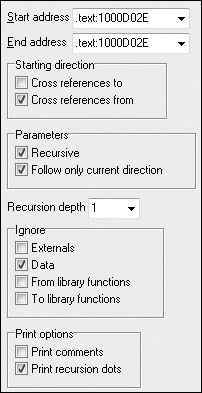
To determine how many Windows API functions DllMain calls
directly, we scroll through the method and look for API calls, or select View ▸ Graphs ▸ User Xrefs Chart to open
the dialog shown in Figure C-16.
The start and end address should correspond to the start of DllMain—specifically, 0x1000D02E. Because we care only about the cross-references
from
DllMain, we select a recursion depth of 1 to display only the
functions that DllMain calls directly. Figure C-17 shows the resulting graph. (The API calls are
seen in gray.) To see all functions called at a recursive depth of 2, follow the same steps and
select a recursion depth of 2. The result will be a much larger graph, which even shows a recursive
call back to DllMain.
As referenced in question 14, there is a call to Sleep at 0x10001358, as shown in the following listing. Sleep takes one parameter—the number of milliseconds to sleep—and we see it
pushed on the stack as EAX.
10001341         mov     eax, off_10019020
10001346         add     eax, 0Dh
10001349         push    eax     ; Str
1000134A         call    ds:atoi
10001350         imul    eax, 3E8h
10001356         pop     ecx
10001357         push    eax     ; dwMilliseconds
10001358         call    ds:Sleep
Working backward, it looks like EAX is multiplied by 0x3E8 (or 1000 in decimal), which tells
us that the result of the call to atoi is multiplied by 1000 to
get the number of seconds to sleep. Again working backward, we also see that off_10019020 is moved into EAX. We can see what
is at the offset by double-clicking it. This is a reference to the string [This is CTI]30.
Next, we see that 0xD is added to the offset, which causes EAX to point to 30 for the call to
atoi, which will convert the string 30 into the number 30. Multiplying 30 by 1000, we get 30,000 milliseconds (30 seconds),
and that is how long this program will sleep if the strings are the same upon execution.
As referenced in question 15, a call to socket at
0x10001701 is shown in the left column of Table C-1. We see that 6, 1, and 2 are pushed onto the stack. These numbers correspond to symbolic
constants that are described on the MSDN page for socket.
Right-clicking each of the numbers and selecting Use Symbolic
Constant presents a dialog listing all of the constants that IDA Pro has for a particular
value. In this example, the number 2 corresponds to AF_INET,
which is used for setting up an IPv4 socket; 1 stands for SOCK_STREAM, and 6 stands for IPPROTO_TCP. Therefore,
this socket will be configured for TCP over IPv4 (commonly used for HTTP).
To answer question 17, we search for the in instruction by
selecting Search ▸ Text and entering in (we could also select Search ▸ Sequence of
Bytes and searching for ED, the opcode for the
in instruction). If we check Find All
Occurrences in the search dialog, either option will present a new window listing all
matches. Scrolling through the results shows only one instance of the in instruction at 0x100061DB, as follows:
100061C7         mov     eax, 564D5868h ; "VMXh"
100061CC         mov     ebx, 0
100061D1         mov     ecx, 0Ah
100061D6         mov     edx, 5658h
100061DB         in      eax, dx
The mov instruction at 0x100061C7 moves 0x564D5868 into
EAX. Right-clicking this value shows that it corresponds to the ASCII string VMXh, which confirms that this snippet of code is an anti-virtual machine
technique being employed by the malware. (We discuss the specifics of this technique and others in
Chapter 17.) Checking the cross-references to the function
that executes this technique offers further confirmation when we see Found
Virtual
Machine in the code after a comparison.
As referenced by question 18, we jump our cursor to 0x1001D988 using the G key. Here, we see what looks like random bytes of data and nothing readable. As suggested, we run the Python script provided by selecting File ▸ Script File and selecting the Python script, shown in the following listing.
sea = ScreenEA() ❶

for i in range(0x00,0x50):
     b = Byte(sea+i)
     decoded_byte = b ^ 0x55 ❷
     PatchByte(sea+i,decoded_byte)
At ❶, the script grabs the current location
of the cursor, for use as an offset to decode the data. Next, it loops from 0 to 0x50 and grabs the
value of each byte using the call to Byte. It takes each byte and
XORs it with 0x55 at ❷. Finally, it patches the byte in the IDA Pro display without modifying the original
file. You can easily customize this script for your own use.
After the script runs, we see that the data at 0x1001D988 has been changed to something more
readable. We can turn this into an ASCII string by pressing the A key on the keyboard with the
cursor at 0x1001D988. This reveals the string xdoor is this backdoor,
string decoded for Practical Malware Analysis Lab :)1234.