Table of Contents for
Practical Malware Analysis
 Practical Malware Analysis
Published by
No Starch Press, 2012
Practical Malware Analysis
Published by
No Starch Press, 2012
- Cover
- Practical Malware Analysis: The Hands-On Guide to Dissecting Malicious Software
- Praise for Practical Malware Analysis
- Warning
- About the Authors
- About the Technical Reviewer
- About the Contributing Authors
- Foreword
- Acknowledgments
- Individual Thanks
- Introduction
- What Is Malware Analysis?
- Prerequisites
- Practical, Hands-On Learning
- What’s in the Book?
- 0. Malware Analysis Primer
- The Goals of Malware Analysis
- Malware Analysis Techniques
- Types of Malware
- General Rules for Malware Analysis
- I. Basic Analysis
- 1. Basic Static Techniques
- Antivirus Scanning: A Useful First Step
- Hashing: A Fingerprint for Malware
- Finding Strings
- Packed and Obfuscated Malware
- Portable Executable File Format
- Linked Libraries and Functions
- Static Analysis in Practice
- The PE File Headers and Sections
- Conclusion
- Labs
- 2. Malware Analysis in Virtual Machines
- The Structure of a Virtual Machine
- Creating Your Malware Analysis Machine
- Using Your Malware Analysis Machine
- The Risks of Using VMware for Malware Analysis
- Record/Replay: Running Your Computer in Reverse
- Conclusion
- 3. Basic Dynamic Analysis
- Sandboxes: The Quick-and-Dirty Approach
- Running Malware
- Monitoring with Process Monitor
- Viewing Processes with Process Explorer
- Comparing Registry Snapshots with Regshot
- Faking a Network
- Packet Sniffing with Wireshark
- Using INetSim
- Basic Dynamic Tools in Practice
- Conclusion
- Labs
- II. Advanced Static Analysis
- 4. A Crash Course in x86 Disassembly
- Levels of Abstraction
- Reverse-Engineering
- The x86 Architecture
- Conclusion
- 5. IDA Pro
- Loading an Executable
- The IDA Pro Interface
- Using Cross-References
- Analyzing Functions
- Using Graphing Options
- Enhancing Disassembly
- Extending IDA with Plug-ins
- Conclusion
- Labs
- 6. Recognizing C Code Constructs in Assembly
- Global vs. Local Variables
- Disassembling Arithmetic Operations
- Recognizing if Statements
- Recognizing Loops
- Understanding Function Call Conventions
- Analyzing switch Statements
- Disassembling Arrays
- Identifying Structs
- Analyzing Linked List Traversal
- Conclusion
- Labs
- 7. Analyzing Malicious Windows Programs
- The Windows API
- The Windows Registry
- Networking APIs
- Following Running Malware
- Kernel vs. User Mode
- The Native API
- Conclusion
- Labs
- III. Advanced Dynamic Analysis
- 8. Debugging
- Source-Level vs. Assembly-Level Debuggers
- Kernel vs. User-Mode Debugging
- Using a Debugger
- Exceptions
- Modifying Execution with a Debugger
- Modifying Program Execution in Practice
- Conclusion
- 9. OllyDbg
- Loading Malware
- The OllyDbg Interface
- Memory Map
- Viewing Threads and Stacks
- Executing Code
- Breakpoints
- Loading DLLs
- Tracing
- Exception Handling
- Patching
- Analyzing Shellcode
- Assistance Features
- Plug-ins
- Scriptable Debugging
- Conclusion
- Labs
- 10. Kernel Debugging with WinDbg
- Drivers and Kernel Code
- Setting Up Kernel Debugging
- Using WinDbg
- Microsoft Symbols
- Kernel Debugging in Practice
- Rootkits
- Loading Drivers
- Kernel Issues for Windows Vista, Windows 7, and x64 Versions
- Conclusion
- Labs
- IV. Malware Functionality
- 11. Malware Behavior
- Downloaders and Launchers
- Backdoors
- Credential Stealers
- Persistence Mechanisms
- Privilege Escalation
- Covering Its Tracks—User-Mode Rootkits
- Conclusion
- Labs
- 12. Covert Malware Launching
- Launchers
- Process Injection
- Process Replacement
- Hook Injection
- Detours
- APC Injection
- Conclusion
- Labs
- 13. Data Encoding
- The Goal of Analyzing Encoding Algorithms
- Simple Ciphers
- Common Cryptographic Algorithms
- Custom Encoding
- Decoding
- Conclusion
- Labs
- 14. Malware-Focused Network Signatures
- Network Countermeasures
- Safely Investigate an Attacker Online
- Content-Based Network Countermeasures
- Combining Dynamic and Static Analysis Techniques
- Understanding the Attacker’s Perspective
- Conclusion
- Labs
- V. Anti-Reverse-Engineering
- 15. Anti-Disassembly
- Understanding Anti-Disassembly
- Defeating Disassembly Algorithms
- Anti-Disassembly Techniques
- Obscuring Flow Control
- Thwarting Stack-Frame Analysis
- Conclusion
- Labs
- 16. Anti-Debugging
- Windows Debugger Detection
- Identifying Debugger Behavior
- Interfering with Debugger Functionality
- Debugger Vulnerabilities
- Conclusion
- Labs
- 17. Anti-Virtual Machine Techniques
- VMware Artifacts
- Vulnerable Instructions
- Tweaking Settings
- Escaping the Virtual Machine
- Conclusion
- Labs
- 18. Packers and Unpacking
- Packer Anatomy
- Identifying Packed Programs
- Unpacking Options
- Automated Unpacking
- Manual Unpacking
- Tips and Tricks for Common Packers
- Analyzing Without Fully Unpacking
- Packed DLLs
- Conclusion
- Labs
- VI. Special Topics
- 19. Shellcode Analysis
- Loading Shellcode for Analysis
- Position-Independent Code
- Identifying Execution Location
- Manual Symbol Resolution
- A Full Hello World Example
- Shellcode Encodings
- NOP Sleds
- Finding Shellcode
- Conclusion
- Labs
- 20. C++ Analysis
- Object-Oriented Programming
- Virtual vs. Nonvirtual Functions
- Creating and Destroying Objects
- Conclusion
- Labs
- 21. 64-Bit Malware
- Why 64-Bit Malware?
- Differences in x64 Architecture
- Windows 32-Bit on Windows 64-Bit
- 64-Bit Hints at Malware Functionality
- Conclusion
- Labs
- A. Important Windows Functions
- B. Tools for Malware Analysis
- C. Solutions to Labs
- Lab 1-1 Solutions
- Lab 1-2 Solutions
- Lab 1-3 Solutions
- Lab 1-4 Solutions
- Lab 3-1 Solutions
- Lab 3-2 Solutions
- Lab 3-3 Solutions
- Lab 3-4 Solutions
- Lab 5-1 Solutions
- Lab 6-1 Solutions
- Lab 6-2 Solutions
- Lab 6-3 Solutions
- Lab 6-4 Solutions
- Lab 7-1 Solutions
- Lab 7-2 Solutions
- Lab 7-3 Solutions
- Lab 9-1 Solutions
- Lab 9-2 Solutions
- Lab 9-3 Solutions
- Lab 10-1 Solutions
- Lab 10-2 Solutions
- Lab 10-3 Solutions
- Lab 11-1 Solutions
- Lab 11-2 Solutions
- Lab 11-3 Solutions
- Lab 12-1 Solutions
- Lab 12-2 Solutions
- Lab 12-3 Solutions
- Lab 12-4 Solutions
- Lab 13-1 Solutions
- Lab 13-2 Solutions
- Lab 13-3 Solutions
- Lab 14-1 Solutions
- Lab 14-2 Solutions
- Lab 14-3 Solutions
- Lab 15-1 Solutions
- Lab 15-2 Solutions
- Lab 15-3 Solutions
- Lab 16-1 Solutions
- Lab 16-2 Solutions
- Lab 16-3 Solutions
- Lab 17-1 Solutions
- Lab 17-2 Solutions
- Lab 17-3 Solutions
- Lab 18-1 Solutions
- Lab 18-2 Solutions
- Lab 18-3 Solutions
- Lab 18-4 Solutions
- Lab 18-5 Solutions
- Lab 19-1 Solutions
- Lab 19-2 Solutions
- Lab 19-3 Solutions
- Lab 20-1 Solutions
- Lab 20-2 Solutions
- Lab 20-3 Solutions
- Lab 21-1 Solutions
- Lab 21-2 Solutions
- Index
- Index
- Index
- Index
- Index
- Index
- Index
- Index
- Index
- Index
- Index
- Index
- Index
- Index
- Index
- Index
- Index
- Index
- Index
- Index
- Index
- Index
- Index
- Index
- Index
- Index
- Index
- Updates
- About the Authors
- Copyright
OllyDbg has standard plug-ins and many additional ones available for download. You’ll find a decent collection of OllyDbg plug-ins that are useful for malware analysis at http://www.openrce.org/downloads/browse/OllyDbg_Plugins.
OllyDbg plug-ins come as DLLs that you place in the root OllyDbg install directory. Once in that directory, the plug-ins should be recognized automatically and added to the Plugins menu.
Note
Writing plug-ins in OllyDbg can be a tedious process. If you wish to extend the functionality of OllyDbg, we recommend writing Python scripts, as described later in the chapter, in Scriptable Debugging.
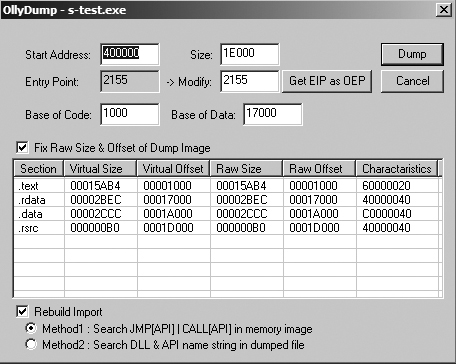
OllyDump is the most commonly used OllyDbg plug-in because it provides the ability to dump a debugged process to a PE file. OllyDump tries to reverse the process that the loader performed when it loaded the executable; however, it will use the current state of the various sections (code, data, and so on) as they exist in memory. (This plug-in is typically used for unpacking, which we’ll discuss extensively in Chapter 18.)
Figure 9-16 shows the OllyDump window. When dumping, you can manually set the entry point and the offsets of the sections, although we recommend that you let OllyDbg do this for you automatically.
The Hide Debugger plug-in employs a number of methods to hide OllyDbg from debugger detection. Many malware analysts run this plug-in all the time, just in case the malware employs anti-debugging.
This plug-in specifically protects against IsDebuggerPresent checks, FindWindow checks, unhandled
exception tricks, and the OuputDebugString exploit against
OllyDbg. (We discuss anti-debugging techniques in Chapter 16.)
The Command Line plug-in allows you to have command-line access to OllyDbg. The command line can create a WinDbg-like experience, although not many users of OllyDbg take advantage of it. (The WinDbg debugger is discussed in the next chapter.)
To activate the command-line window, select Plugins ▶ Command Line ▶ Command Line. Table 9-3 shows the list of common commands. Additional commands can be found in the help file that comes with the Command Line plug-in.
Table 9-3. Commands for the OllyDbg Command Line
Command | Function |
|---|---|
| Set software breakpoint |
| Remove breakpoint |
| Set hardware breakpoint on execution |
| Set breakpoint on each call to label |
| Pause execution |
| Run program |
| Run until address |
| Step into |
| Step over |
| Dump memory |
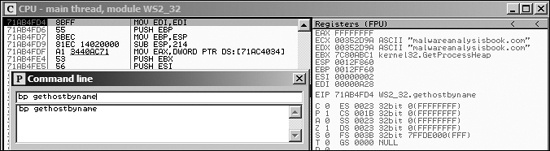
When debugging, you will often want to break execution at the start of an imported function in order to see the parameters being passed to that function. You can use the command line to quickly set a breakpoint at the start of an imported function.
In the example in Figure 9-17, we have a piece
of malware with strings obfuscated; however, it has an import of gethostbyname. As shown in the figure, we execute the command bp
gethostbyname at the command line, which sets a breakpoint at the start of the gethostbyname function. After we set the breakpoint, we run the program,
and it breaks at the start of gethostbyname. Looking at the
parameters, we see the hostname it intends to resolve (malwareanalysisbook.com in this example).
The Bookmarks plug-in is included by default in OllyDbg. It enables you to add bookmarks of memory locations, so that you can get to them easily in the future without needing to remember the addresses.
To add a bookmark, right-click in the disassembler window and select Bookmark ▶ Insert Bookmark. To view bookmarks, select Plugins ▶ Bookmarks ▶ Bookmarks, and then click any of your bookmarks to go to that location.