Table of Contents for
Practical Malware Analysis
 Practical Malware Analysis
Published by
No Starch Press, 2012
Practical Malware Analysis
Published by
No Starch Press, 2012
- Cover
- Practical Malware Analysis: The Hands-On Guide to Dissecting Malicious Software
- Praise for Practical Malware Analysis
- Warning
- About the Authors
- About the Technical Reviewer
- About the Contributing Authors
- Foreword
- Acknowledgments
- Individual Thanks
- Introduction
- What Is Malware Analysis?
- Prerequisites
- Practical, Hands-On Learning
- What’s in the Book?
- 0. Malware Analysis Primer
- The Goals of Malware Analysis
- Malware Analysis Techniques
- Types of Malware
- General Rules for Malware Analysis
- I. Basic Analysis
- 1. Basic Static Techniques
- Antivirus Scanning: A Useful First Step
- Hashing: A Fingerprint for Malware
- Finding Strings
- Packed and Obfuscated Malware
- Portable Executable File Format
- Linked Libraries and Functions
- Static Analysis in Practice
- The PE File Headers and Sections
- Conclusion
- Labs
- 2. Malware Analysis in Virtual Machines
- The Structure of a Virtual Machine
- Creating Your Malware Analysis Machine
- Using Your Malware Analysis Machine
- The Risks of Using VMware for Malware Analysis
- Record/Replay: Running Your Computer in Reverse
- Conclusion
- 3. Basic Dynamic Analysis
- Sandboxes: The Quick-and-Dirty Approach
- Running Malware
- Monitoring with Process Monitor
- Viewing Processes with Process Explorer
- Comparing Registry Snapshots with Regshot
- Faking a Network
- Packet Sniffing with Wireshark
- Using INetSim
- Basic Dynamic Tools in Practice
- Conclusion
- Labs
- II. Advanced Static Analysis
- 4. A Crash Course in x86 Disassembly
- Levels of Abstraction
- Reverse-Engineering
- The x86 Architecture
- Conclusion
- 5. IDA Pro
- Loading an Executable
- The IDA Pro Interface
- Using Cross-References
- Analyzing Functions
- Using Graphing Options
- Enhancing Disassembly
- Extending IDA with Plug-ins
- Conclusion
- Labs
- 6. Recognizing C Code Constructs in Assembly
- Global vs. Local Variables
- Disassembling Arithmetic Operations
- Recognizing if Statements
- Recognizing Loops
- Understanding Function Call Conventions
- Analyzing switch Statements
- Disassembling Arrays
- Identifying Structs
- Analyzing Linked List Traversal
- Conclusion
- Labs
- 7. Analyzing Malicious Windows Programs
- The Windows API
- The Windows Registry
- Networking APIs
- Following Running Malware
- Kernel vs. User Mode
- The Native API
- Conclusion
- Labs
- III. Advanced Dynamic Analysis
- 8. Debugging
- Source-Level vs. Assembly-Level Debuggers
- Kernel vs. User-Mode Debugging
- Using a Debugger
- Exceptions
- Modifying Execution with a Debugger
- Modifying Program Execution in Practice
- Conclusion
- 9. OllyDbg
- Loading Malware
- The OllyDbg Interface
- Memory Map
- Viewing Threads and Stacks
- Executing Code
- Breakpoints
- Loading DLLs
- Tracing
- Exception Handling
- Patching
- Analyzing Shellcode
- Assistance Features
- Plug-ins
- Scriptable Debugging
- Conclusion
- Labs
- 10. Kernel Debugging with WinDbg
- Drivers and Kernel Code
- Setting Up Kernel Debugging
- Using WinDbg
- Microsoft Symbols
- Kernel Debugging in Practice
- Rootkits
- Loading Drivers
- Kernel Issues for Windows Vista, Windows 7, and x64 Versions
- Conclusion
- Labs
- IV. Malware Functionality
- 11. Malware Behavior
- Downloaders and Launchers
- Backdoors
- Credential Stealers
- Persistence Mechanisms
- Privilege Escalation
- Covering Its Tracks—User-Mode Rootkits
- Conclusion
- Labs
- 12. Covert Malware Launching
- Launchers
- Process Injection
- Process Replacement
- Hook Injection
- Detours
- APC Injection
- Conclusion
- Labs
- 13. Data Encoding
- The Goal of Analyzing Encoding Algorithms
- Simple Ciphers
- Common Cryptographic Algorithms
- Custom Encoding
- Decoding
- Conclusion
- Labs
- 14. Malware-Focused Network Signatures
- Network Countermeasures
- Safely Investigate an Attacker Online
- Content-Based Network Countermeasures
- Combining Dynamic and Static Analysis Techniques
- Understanding the Attacker’s Perspective
- Conclusion
- Labs
- V. Anti-Reverse-Engineering
- 15. Anti-Disassembly
- Understanding Anti-Disassembly
- Defeating Disassembly Algorithms
- Anti-Disassembly Techniques
- Obscuring Flow Control
- Thwarting Stack-Frame Analysis
- Conclusion
- Labs
- 16. Anti-Debugging
- Windows Debugger Detection
- Identifying Debugger Behavior
- Interfering with Debugger Functionality
- Debugger Vulnerabilities
- Conclusion
- Labs
- 17. Anti-Virtual Machine Techniques
- VMware Artifacts
- Vulnerable Instructions
- Tweaking Settings
- Escaping the Virtual Machine
- Conclusion
- Labs
- 18. Packers and Unpacking
- Packer Anatomy
- Identifying Packed Programs
- Unpacking Options
- Automated Unpacking
- Manual Unpacking
- Tips and Tricks for Common Packers
- Analyzing Without Fully Unpacking
- Packed DLLs
- Conclusion
- Labs
- VI. Special Topics
- 19. Shellcode Analysis
- Loading Shellcode for Analysis
- Position-Independent Code
- Identifying Execution Location
- Manual Symbol Resolution
- A Full Hello World Example
- Shellcode Encodings
- NOP Sleds
- Finding Shellcode
- Conclusion
- Labs
- 20. C++ Analysis
- Object-Oriented Programming
- Virtual vs. Nonvirtual Functions
- Creating and Destroying Objects
- Conclusion
- Labs
- 21. 64-Bit Malware
- Why 64-Bit Malware?
- Differences in x64 Architecture
- Windows 32-Bit on Windows 64-Bit
- 64-Bit Hints at Malware Functionality
- Conclusion
- Labs
- A. Important Windows Functions
- B. Tools for Malware Analysis
- C. Solutions to Labs
- Lab 1-1 Solutions
- Lab 1-2 Solutions
- Lab 1-3 Solutions
- Lab 1-4 Solutions
- Lab 3-1 Solutions
- Lab 3-2 Solutions
- Lab 3-3 Solutions
- Lab 3-4 Solutions
- Lab 5-1 Solutions
- Lab 6-1 Solutions
- Lab 6-2 Solutions
- Lab 6-3 Solutions
- Lab 6-4 Solutions
- Lab 7-1 Solutions
- Lab 7-2 Solutions
- Lab 7-3 Solutions
- Lab 9-1 Solutions
- Lab 9-2 Solutions
- Lab 9-3 Solutions
- Lab 10-1 Solutions
- Lab 10-2 Solutions
- Lab 10-3 Solutions
- Lab 11-1 Solutions
- Lab 11-2 Solutions
- Lab 11-3 Solutions
- Lab 12-1 Solutions
- Lab 12-2 Solutions
- Lab 12-3 Solutions
- Lab 12-4 Solutions
- Lab 13-1 Solutions
- Lab 13-2 Solutions
- Lab 13-3 Solutions
- Lab 14-1 Solutions
- Lab 14-2 Solutions
- Lab 14-3 Solutions
- Lab 15-1 Solutions
- Lab 15-2 Solutions
- Lab 15-3 Solutions
- Lab 16-1 Solutions
- Lab 16-2 Solutions
- Lab 16-3 Solutions
- Lab 17-1 Solutions
- Lab 17-2 Solutions
- Lab 17-3 Solutions
- Lab 18-1 Solutions
- Lab 18-2 Solutions
- Lab 18-3 Solutions
- Lab 18-4 Solutions
- Lab 18-5 Solutions
- Lab 19-1 Solutions
- Lab 19-2 Solutions
- Lab 19-3 Solutions
- Lab 20-1 Solutions
- Lab 20-2 Solutions
- Lab 20-3 Solutions
- Lab 21-1 Solutions
- Lab 21-2 Solutions
- Index
- Index
- Index
- Index
- Index
- Index
- Index
- Index
- Index
- Index
- Index
- Index
- Index
- Index
- Index
- Index
- Index
- Index
- Index
- Index
- Index
- Index
- Index
- Index
- Index
- Index
- Index
- Updates
- About the Authors
- Copyright
First, we run PEiD on the Lab18-03.exe file, and it tells us that the packer is PECompact 1.68 - 1.84 -> Jeremy Collake. We load the program into OllyDbg and see several warnings that the file may be packed. We can ignore these warnings.
The program starts at address 0x00405130. We try the Find OEP by Section Hop (Trace Into) option in the OllyDump plug-in. We see the code shown in Example C-176 as OllyDump’s guess at the OEP. However, there are several reasons this doesn’t look like the OEP. The most obvious is that it accesses values above the base pointer at ❶. If this were the file’s entry point, any data above the base pointer would not have been initialized.
Example C-176. OllyDump’s guess at the OEP after using the Find OEP by Section Hop (Trace Into) option
0040A110   ENTER 0,0
0040A114   PUSH EBP
0040A115  ❶MOV ESI,DWORD PTR SS:[EBP+8]
0040A118   MOV EDI,DWORD PTR SS:[EBP+C]
0040A11B   CLD
0040A11C   MOV DL,80
0040A11E   MOV AL,BYTE PTR DS:[ESI]
0040A120   INC ESI
0040A121   MOV BYTE PTR DS:[EDI],AL
Next, we try the Find OEP by Section Hop (Trace Over)
option and we see that the code stops on a ret instruction at the
end of a function in ntdll, which is clearly not the OEP.
Since the OllyDump plug-in didn’t work, we examine the code to see if the tail jump is
easy to spot. As shown in Example C-177, we eventually come to some code that
looks like a tail jump. This code is a retn instruction followed
by a bunch of zero bytes. We know that the code can’t go past this point.
Example C-177. A possible tail jump
00405622   SCAS DWORD PTR ES:[EDI]
00405623   ADD BH,CH
00405625   STC
00405626  ❶RETN 0EC3F
00405629   ADD BYTE PTR DS:[EAX],AL
0040562B   ADD BYTE PTR DS:[EAX],AL
0040562D   ADD BYTE PTR DS:[EAX],AL
Now, we set a breakpoint on the retn instruction at
❶ and start our program. First, we set a regular
breakpoint (INT 3). OllyDbg displays a warning, because the
breakpoint is outside the code section and may cause problems. When we run our program, we
eventually get an exception that the program can’t handle, and we see that the code at our
breakpoint has been changed. Now we know that the code is self-modifying and that our breakpoint has
not worked properly.
When dealing with self-modifying code, it’s often useful to use a hardware breakpoint
instead of a software breakpoint because the self-modifying code will overwrite the INT 3 (0xcc) instruction used to implement software breakpoints. Starting
over with a hardware breakpoint, we run the program and see that it starts to run without ever
hitting our breakpoint. This tells us that we probably haven’t found the tail jump and we need
to try another strategy.
Looking at the entry point of the packed program, we see the instructions shown in Example C-178.
Example C-178. Start of the unpacking stub
00405130  ❶JMP SHORT Lab09-02.00405138
00405132   PUSH 1577
00405137   RETN
00405138  ❷PUSHFD
00405139  ❸PUSHAD
0040513A  ❹CALL Lab09-02.00405141
0040513F   XOR EAX,EAX
The first instruction at ❶ is an unconditional
jump that skips the next two instructions. The first two instructions that affect memory are
pushfd at ❷ and
pushad at ❸. These
instructions save all of the registers and flags. It’s likely that the packing program will
restore all the registers and flags immediately before it jumps to the OEP, so we can try to find
the OEP by setting an access breakpoint on the stack. Presumably, there will be a popad or popfd instruction right before
the tail jump, which will lead us to the OEP.
We restart the program and step-over the first three instructions. The program should be
stopped at the call instruction at ❹ in Example C-178. Now we need to
find the value of the stack pointer to set a breakpoint. To do so, we examine the registers window,
as shown on the top right of Figure C-67.
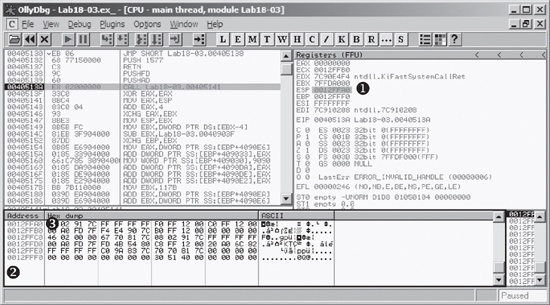
The stack is at address 0x12FFA0, as shown at ❶ in Figure C-67. To set a breakpoint, we first load that address in the memory dump by right-clicking ❶ and selecting Follow in Dump. This will make the memory dump window at ❷ appear as it does in Figure C-67.
To set a breakpoint on the last piece of data pushed onto the stack, we right-click the first data element on the stack at ❸ in Figure C-67 and select Breakpoint ▸ Memory on Access. We then run our program. Unfortunately, it reaches an unhandled exception similar to when we set a breakpoint before. Next, we set the breakpoint with Breakpoint ▸ Hardware, on Access ▸ Dword. When we start our program, our breakpoint is triggered. The program will break at the instructions shown in Example C-179.
Example C-179. Instructions where our stack breakpoint is triggered showing the tail jump
0040754F   POPFD
00407550   PUSH EAX
00407551   PUSH Lab18-03.00401577
00407556   RETN 4
A few instructions into our code, we see a retn instruction
that transfers execution to another location. This is probably the tail jump. We step to that
instruction to determine where it goes and see the code in Example C-180. This
looks like the original code; the call to GetVersion at ❷ is a dead giveaway.
Note
As in Lab18-02.exe, you may need to force OllyDbg to disassemble this code using the Analysis ▸ Analyze Code command.
Example C-180. The OEP for Lab 18-3 Solutions
00401577  ❶PUSH EBP
00401578   MOV EBP,ESP
0040157A   PUSH -1
0040157C   PUSH Lab18-03.004040C0
00401581   PUSH Lab18-03.0040203C         ;  SE handler installation
00401586   MOV EAX,DWORD PTR FS:[0]
0040158C   PUSH EAX
0040158D   MOV DWORD PTR FS:[0],ESP
00401594   SUB ESP,10
00401597   PUSH EBX
00401598   PUSH ESI
00401599   PUSH EDI
0040159A   MOV DWORD PTR SS:[EBP-18],ESP
0040159D  ❷CALL DWORD PTR DS:[404030]     ;  kernel32.GetVersion
Now, with EIP pointing to the first instruction at ❶, we select Plugins ▸ OllyDump ▸ Dump Debugged Process. We click the Get EIP as OEP button, leaving all the other options with their default settings, and then click Dump. In the dialog, we enter a filename to save a copy of our unpacked program.
When we’re finished, we run the program and open it in IDA Pro to verify that it has been unpacked successfully. A brief analysis of the program reveals that the functionality is the same as Lab09-02.exe.
This packer uses a variety of techniques to make it difficult to unpack and recognize the tail jump. Several of the usual strategies were ineffective because the packer takes explicit steps to thwart them. If using a particular technique seems difficult on a packed program, try different approaches until one works. In rare cases, none of the techniques will work easily.