Table of Contents for
Practical Malware Analysis
 Practical Malware Analysis
Published by
No Starch Press, 2012
Practical Malware Analysis
Published by
No Starch Press, 2012
- Cover
- Practical Malware Analysis: The Hands-On Guide to Dissecting Malicious Software
- Praise for Practical Malware Analysis
- Warning
- About the Authors
- About the Technical Reviewer
- About the Contributing Authors
- Foreword
- Acknowledgments
- Individual Thanks
- Introduction
- What Is Malware Analysis?
- Prerequisites
- Practical, Hands-On Learning
- What’s in the Book?
- 0. Malware Analysis Primer
- The Goals of Malware Analysis
- Malware Analysis Techniques
- Types of Malware
- General Rules for Malware Analysis
- I. Basic Analysis
- 1. Basic Static Techniques
- Antivirus Scanning: A Useful First Step
- Hashing: A Fingerprint for Malware
- Finding Strings
- Packed and Obfuscated Malware
- Portable Executable File Format
- Linked Libraries and Functions
- Static Analysis in Practice
- The PE File Headers and Sections
- Conclusion
- Labs
- 2. Malware Analysis in Virtual Machines
- The Structure of a Virtual Machine
- Creating Your Malware Analysis Machine
- Using Your Malware Analysis Machine
- The Risks of Using VMware for Malware Analysis
- Record/Replay: Running Your Computer in Reverse
- Conclusion
- 3. Basic Dynamic Analysis
- Sandboxes: The Quick-and-Dirty Approach
- Running Malware
- Monitoring with Process Monitor
- Viewing Processes with Process Explorer
- Comparing Registry Snapshots with Regshot
- Faking a Network
- Packet Sniffing with Wireshark
- Using INetSim
- Basic Dynamic Tools in Practice
- Conclusion
- Labs
- II. Advanced Static Analysis
- 4. A Crash Course in x86 Disassembly
- Levels of Abstraction
- Reverse-Engineering
- The x86 Architecture
- Conclusion
- 5. IDA Pro
- Loading an Executable
- The IDA Pro Interface
- Using Cross-References
- Analyzing Functions
- Using Graphing Options
- Enhancing Disassembly
- Extending IDA with Plug-ins
- Conclusion
- Labs
- 6. Recognizing C Code Constructs in Assembly
- Global vs. Local Variables
- Disassembling Arithmetic Operations
- Recognizing if Statements
- Recognizing Loops
- Understanding Function Call Conventions
- Analyzing switch Statements
- Disassembling Arrays
- Identifying Structs
- Analyzing Linked List Traversal
- Conclusion
- Labs
- 7. Analyzing Malicious Windows Programs
- The Windows API
- The Windows Registry
- Networking APIs
- Following Running Malware
- Kernel vs. User Mode
- The Native API
- Conclusion
- Labs
- III. Advanced Dynamic Analysis
- 8. Debugging
- Source-Level vs. Assembly-Level Debuggers
- Kernel vs. User-Mode Debugging
- Using a Debugger
- Exceptions
- Modifying Execution with a Debugger
- Modifying Program Execution in Practice
- Conclusion
- 9. OllyDbg
- Loading Malware
- The OllyDbg Interface
- Memory Map
- Viewing Threads and Stacks
- Executing Code
- Breakpoints
- Loading DLLs
- Tracing
- Exception Handling
- Patching
- Analyzing Shellcode
- Assistance Features
- Plug-ins
- Scriptable Debugging
- Conclusion
- Labs
- 10. Kernel Debugging with WinDbg
- Drivers and Kernel Code
- Setting Up Kernel Debugging
- Using WinDbg
- Microsoft Symbols
- Kernel Debugging in Practice
- Rootkits
- Loading Drivers
- Kernel Issues for Windows Vista, Windows 7, and x64 Versions
- Conclusion
- Labs
- IV. Malware Functionality
- 11. Malware Behavior
- Downloaders and Launchers
- Backdoors
- Credential Stealers
- Persistence Mechanisms
- Privilege Escalation
- Covering Its Tracks—User-Mode Rootkits
- Conclusion
- Labs
- 12. Covert Malware Launching
- Launchers
- Process Injection
- Process Replacement
- Hook Injection
- Detours
- APC Injection
- Conclusion
- Labs
- 13. Data Encoding
- The Goal of Analyzing Encoding Algorithms
- Simple Ciphers
- Common Cryptographic Algorithms
- Custom Encoding
- Decoding
- Conclusion
- Labs
- 14. Malware-Focused Network Signatures
- Network Countermeasures
- Safely Investigate an Attacker Online
- Content-Based Network Countermeasures
- Combining Dynamic and Static Analysis Techniques
- Understanding the Attacker’s Perspective
- Conclusion
- Labs
- V. Anti-Reverse-Engineering
- 15. Anti-Disassembly
- Understanding Anti-Disassembly
- Defeating Disassembly Algorithms
- Anti-Disassembly Techniques
- Obscuring Flow Control
- Thwarting Stack-Frame Analysis
- Conclusion
- Labs
- 16. Anti-Debugging
- Windows Debugger Detection
- Identifying Debugger Behavior
- Interfering with Debugger Functionality
- Debugger Vulnerabilities
- Conclusion
- Labs
- 17. Anti-Virtual Machine Techniques
- VMware Artifacts
- Vulnerable Instructions
- Tweaking Settings
- Escaping the Virtual Machine
- Conclusion
- Labs
- 18. Packers and Unpacking
- Packer Anatomy
- Identifying Packed Programs
- Unpacking Options
- Automated Unpacking
- Manual Unpacking
- Tips and Tricks for Common Packers
- Analyzing Without Fully Unpacking
- Packed DLLs
- Conclusion
- Labs
- VI. Special Topics
- 19. Shellcode Analysis
- Loading Shellcode for Analysis
- Position-Independent Code
- Identifying Execution Location
- Manual Symbol Resolution
- A Full Hello World Example
- Shellcode Encodings
- NOP Sleds
- Finding Shellcode
- Conclusion
- Labs
- 20. C++ Analysis
- Object-Oriented Programming
- Virtual vs. Nonvirtual Functions
- Creating and Destroying Objects
- Conclusion
- Labs
- 21. 64-Bit Malware
- Why 64-Bit Malware?
- Differences in x64 Architecture
- Windows 32-Bit on Windows 64-Bit
- 64-Bit Hints at Malware Functionality
- Conclusion
- Labs
- A. Important Windows Functions
- B. Tools for Malware Analysis
- C. Solutions to Labs
- Lab 1-1 Solutions
- Lab 1-2 Solutions
- Lab 1-3 Solutions
- Lab 1-4 Solutions
- Lab 3-1 Solutions
- Lab 3-2 Solutions
- Lab 3-3 Solutions
- Lab 3-4 Solutions
- Lab 5-1 Solutions
- Lab 6-1 Solutions
- Lab 6-2 Solutions
- Lab 6-3 Solutions
- Lab 6-4 Solutions
- Lab 7-1 Solutions
- Lab 7-2 Solutions
- Lab 7-3 Solutions
- Lab 9-1 Solutions
- Lab 9-2 Solutions
- Lab 9-3 Solutions
- Lab 10-1 Solutions
- Lab 10-2 Solutions
- Lab 10-3 Solutions
- Lab 11-1 Solutions
- Lab 11-2 Solutions
- Lab 11-3 Solutions
- Lab 12-1 Solutions
- Lab 12-2 Solutions
- Lab 12-3 Solutions
- Lab 12-4 Solutions
- Lab 13-1 Solutions
- Lab 13-2 Solutions
- Lab 13-3 Solutions
- Lab 14-1 Solutions
- Lab 14-2 Solutions
- Lab 14-3 Solutions
- Lab 15-1 Solutions
- Lab 15-2 Solutions
- Lab 15-3 Solutions
- Lab 16-1 Solutions
- Lab 16-2 Solutions
- Lab 16-3 Solutions
- Lab 17-1 Solutions
- Lab 17-2 Solutions
- Lab 17-3 Solutions
- Lab 18-1 Solutions
- Lab 18-2 Solutions
- Lab 18-3 Solutions
- Lab 18-4 Solutions
- Lab 18-5 Solutions
- Lab 19-1 Solutions
- Lab 19-2 Solutions
- Lab 19-3 Solutions
- Lab 20-1 Solutions
- Lab 20-2 Solutions
- Lab 20-3 Solutions
- Lab 21-1 Solutions
- Lab 21-2 Solutions
- Index
- Index
- Index
- Index
- Index
- Index
- Index
- Index
- Index
- Index
- Index
- Index
- Index
- Index
- Index
- Index
- Index
- Index
- Index
- Index
- Index
- Index
- Index
- Index
- Index
- Index
- Index
- Updates
- About the Authors
- Copyright
Modern disassemblers such as IDA Pro do an excellent job of correlating function calls and deducing high-level information based on the knowledge of how functions are related to each other. This type of analysis works well against code written in a standard programming style with a standard compiler, but is easily defeated by the malware author.
Function pointers are a common programming idiom in the C programming language and are used extensively behind the scenes in C++. Despite this, they still prove to be problematic to a disassembler.
Using function pointers in the intended fashion in a C program can greatly reduce the information that can be automatically deduced about program flow. If function pointers are used in handwritten assembly or crafted in a nonstandard way in source code, the results can be difficult to reverse-engineer without dynamic analysis.
The following assembly listing shows two functions. The second function uses the first through a function pointer.
004011C0 sub_4011C0      proc near               ; DATA XREF: sub_4011D0+5o
004011C0
004011C0 arg_0           = dword ptr  8
004011C0
004011C0                 push    ebp
004011C1                 mov     ebp, esp
004011C3                 mov     eax, [ebp+arg_0]
004011C6                 shl     eax, 2
004011C9                 pop     ebp
004011CA                 retn
004011CA sub_4011C0      endp

004011D0 sub_4011D0      proc near               ; CODE XREF: _main+19p
004011D0                                         ; sub_401040+8Bp
004011D0
004011D0 var_4           = dword ptr -4
004011D0 arg_0           = dword ptr  8
004011D0
004011D0                 push    ebp
004011D1                 mov     ebp, esp
004011D3                 push    ecx
004011D4                 push    esi
004011D5                 mov    ❶[ebp+var_4], offset sub_4011C0
004011DC                 push    2Ah
004011DE                 call   ❷[ebp+var_4]
004011E1                 add     esp, 4
004011E4                 mov     esi, eax
004011E6                 mov     eax, [ebp+arg_0]
004011E9                 push    eax
004011EA                 call   ❸[ebp+var_4]
004011ED                 add     esp, 4
004011F0                 lea     eax, [esi+eax+1]
004011F4                 pop     esi
004011F5                 mov     esp, ebp
004011F7                 pop     ebp
004011F8                 retn
004011F8 sub_4011D0      endp
While this example isn’t particularly difficult to reverse-engineer, it does expose one
key issue. The function sub_4011C0 is actually called from two
different places (❷ and ❸) within the sub_4011D0 function, but it shows only
one cross-reference at ❶. This is because IDA Pro was
able to detect the initial reference to the function when its offset was loaded into a stack
variable on line 004011D5. What IDA Pro does not detect, however,
is the fact that this function is then called twice from the locations ❷ and ❸. Any function
prototype information that would normally be autopropagated to the calling function is also
lost.
When used extensively and in combination with other anti-disassembly techniques, function pointers can greatly compound the complexity and difficulty of reverse-engineering.
All of the information not autopropagated upward, such as function argument names, can
be added manually as comments by the malware analyst. In order to add actual cross-references, we
must use the IDC language (or IDAPython) to tell IDA Pro that the function sub_4011C0 is actually called from the two locations in the other function.
The IDC function we use is called AddCodeXref. It takes
three arguments: the location the reference is from, the location the reference is to, and a flow
type. The function can support several different flow types, but for our purposes, the most useful
are either fl_CF for a normal call instruction or a fl_JF for a jump instruction. To
fix the previous example assembly code listing in IDA Pro, the following script was executed:
AddCodeXref(0x004011DE, 0x004011C0, fl_CF);
AddCodeXref(0x004011EA, 0x004011C0, fl_CF);
The call and jmp
instructions are not the only instructions to transfer control within a program. The counterpart to
the call instruction is retn
(also represented as ret). The call instruction acts just like the jmp instruction,
except it pushes a return pointer on the stack. The return point will be the memory address
immediately following the end of the call instruction
itself.
As call is a combination of jmp and push, retn
is a combination of pop and jmp. The retn instruction pops the value from the top
of the stack and jumps to it. It is typically used to return from a function call, but there is no
architectural reason that it can’t be used for general flow control.
When the retn instruction is used in ways other than to
return from a function call, even the most intelligent disassemblers can be left in the dark. The
most obvious result of this technique is that the disassembler doesn’t show any code
cross-reference to the target being jumped to. Another key benefit of this technique is that the
disassembler will prematurely terminate the function.
Let’s examine the following assembly fragment:
004011C0 sub_4011C0      proc near               ; CODE XREF: _main+19p
004011C0                                         ; sub_401040+8Bp
004011C0
004011C0 var_4           = byte ptr -4
004011C0
004011C0                 call    $+5
004011C5                 add     [esp+4+var_4], 5
004011C9                 retn
004011C9 sub_4011C0      endp ; sp-analysis failed
004011C9
004011CA ; ------------------------------------------------------------
004011CA                 push    ebp
004011CB                 mov     ebp, esp
004011CD                 mov     eax, [ebp+8]
004011D0                 imul    eax, 2Ah
004011D3                 mov     esp, ebp
004011D5                 pop     ebp
004011D6                 retn
This is a simple function that takes a number and returns the product of that number times 42.
Unfortunately, IDA Pro is unable to deduce any meaningful information about this function because it
has been defeated by a rogue retn instruction. Notice that it has
not detected the presence of an argument to this function. The first three instructions accomplish
the task of jumping to the real start of the function. Let’s examine each of these
instructions.
The first instruction in this function is call $+5. This
instruction simply calls the location immediately following itself, which results in a pointer to
this memory location being placed on the stack. In this specific example, the value 0x004011C5 will be placed at the top of the stack after this instruction
executes. This is a common instruction found in code that needs to be self-referential or
position-independent, and will be covered in more detail in Chapter 19.
The next instruction is add [esp+4+var_4], 5. If you are
used to reading IDA Pro disassembly, you might think that this instruction is referencing a stack
variable var_4. In this case, IDA Pro’s stack-frame
analysis was incorrect, and this instruction was not referencing what would be a normal stack
variable, autonamed to var_4 in an ordinary function. This may
seem confusing at first, but notice that at the top of the function, var_4 is defined as the constant -4. This means that
what is inside the brackets is [esp+4+(-4)], which can also be
represented as [esp+0] or simply [esp]. This instruction is adding five to the value at the top of the stack, which was
0x004011C5. The result of the addition instruction is that the
value at the top of the stack will be 0x004011CA.
The last instruction in this sequence is the retn
instruction, which has the sole purpose of taking this value off the stack and jumping to it. If you
examine the code at the location 0x004011CA, it appears to be the legitimate beginning of a rather
normal-looking function. This “real” function was determined by IDA Pro to not be part
of any function due to the presence of the rogue retn
instruction.
To repair this example, we could patch over the first three instructions with NOP instructions and adjust the function boundaries to cover the real function.
To adjust the function boundaries, place the cursor in IDA Pro inside the function you wish to
adjust and press ALT-P. Adjust the function end address to the
memory address immediately following the last instruction in the function. To replace the first few
instructions with nop, refer to the script technique described in
NOP-ing Out Instructions with IDA Pro.
The Structured Exception Handling (SEH) mechanism provides a method of flow control that is unable to be followed by disassemblers and will fool debuggers. SEH is a feature of the x86 architecture and is intended to provide a way for the program to handle error conditions intelligently. Programming languages such as C++ and Ada rely heavily on exception handling and translate naturally to SEH when compiled on x86 systems.
Before exploring how to harness SEH to obscure flow control, let’s look at a few basic
concepts about how it operates. Exceptions can be triggered for a number of reasons, such as access
to an invalid memory region or dividing by zero. Additional software exceptions can be raised by
calling the RaiseException function.
The SEH chain is a list of functions designed to handle exceptions within the thread. Each function in the list can either handle the exception or pass it to the next handler in the list. If the exception makes it all the way to the last handler, then it is considered to be an unhandled exception. The last exception handler is the piece of code responsible for triggering the familiar message box that informs the user that “an unhandled exception has occurred.” Exceptions happen regularly in most processes, but are handled silently before they make it to this final state of crashing the process and informing the user.
To find the SEH chain, the OS examines the FS segment register. This register contains a
segment selector that is used to gain access to the Thread Environment Block (TEB). The first
structure within the TEB is the Thread Information Block (TIB). The first element of the TIB (and
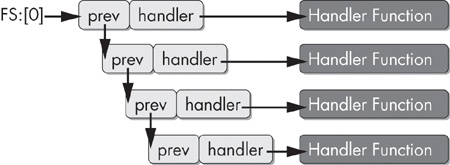
consequently the first bytes of the TEB) is a pointer to the SEH chain. The SEH chain is a simple
linked list of 8-byte data structures called EXCEPTION_REGISTRATION records.
struct _EXCEPTION_REGISTRATION {
   DWORD prev;
   DWORD handler;
};
The first element in the EXCEPTION_REGISTRATION record
points to the previous record. The second field is a pointer to the handler function.
This linked list operates conceptually as a stack. The first record to be called is the last record to be added to the list. The SEH chain grows and shrinks as layers of exception handlers in a program change due to subroutine calls and nested exception handler blocks. For this reason, SEH records are always built on the stack.
In order to use SEH to achieve covert flow control, we need not concern ourselves with how many exception records are currently in the chain. We just need to understand how to add our own handler to the top of this list, as shown in Figure 15-6.
To add a record to this list, we need to construct a new record on the stack. Since the
record structure is simply two DWORDs, we can do this with two
push instructions. The stack grows upward, so the first push will be the pointer to the handler function, and the second push will be the pointer to the next record. We are trying to add a record
to the top of the chain, so the next record in the chain when we finish will be what is currently
the top, which is pointed to by fs:[0]. The following code
performs this sequence.
push ExceptionHandler
push fs:[0]
mov fs:[0], esp
The ExceptionHandler function will be called first whenever
an exception occurs. This action will be subject to the constraints imposed by Microsoft’s
Software Data Execution Prevention (Software DEP, also known as SafeSEH).
Software DEP is a security feature that prevents the addition of third-party exception
handlers at runtime. For purposes of handwritten assembly code, there are several ways to work
around this technology, such as using an assembler that has support for SafeSEH directives. Using
Microsoft’s C compilers, an author can add /SAFESEH:NO to
the linker command line to disable this.
When the ExceptionHandler code is called, the stack will be
drastically altered. Luckily, it is not essential for our purposes to fully examine all the data
that is added to the stack at this point. We must simply understand how to return the stack to its
original position prior to the exception. Remember that our goal is to obscure flow control and not
to properly handle program exceptions.
The OS adds another SEH handler when our handler is called. To return the program to normal
operation, we need to unlink not just our handler, but this handler as well. Therefore, we need to
pull our original stack pointer from esp+8 instead of esp.
mov esp, [esp+8]
mov eax, fs:[0]
mov eax, [eax]
mov eax, [eax]
mov fs:[0], eax
add esp, 8
Let’s bring all this knowledge back to our original goal of obscuring flow control. The following fragment contains a piece of code from a Visual C++ binary that covertly transfers flow to a subroutine. Since there is no pointer to this function and the disassembler doesn’t understand SEH, it appears as though the subroutine has no references, and the disassembler thinks the code immediately following the triggering of the exception will be executed.
00401050                ❷mov     eax, (offset loc_40106B+1)
00401055                 add     eax, 14h
00401058                 push    eax
00401059                 push    large dword ptr fs:0 ; dwMilliseconds
00401060                 mov     large fs:0, esp
00401067                 xor     ecx, ecx
00401069                ❸div     ecx
0040106B
0040106B loc_40106B:                             ; DATA XREF: sub_401050o
0040106B                 call    near ptr Sleep
00401070                 retn
00401070 sub_401050      endp ; sp-analysis failed
00401070
00401070 ; ------------------------------------------------------------------
00401071                 align 10h
00401080                ❶dd 824648Bh, 0A164h, 8B0000h, 0A364008Bh, 0
00401094                 dd 6808C483h
00401098                 dd offset aMysteryCode  ; "Mystery Code"
0040109C                 dd 2DE8h, 4C48300h, 3 dup(0CCCCCCCCh)
In this example, IDA Pro has not only missed the fact that the subroutine at location 401080
❶ was not called, but it also failed to even disassemble
this function. This code sets up an exception handler covertly by first setting the register EAX to
the value 40106C
❷, and then adding 14h to it to build a pointer to the function 401080. A
divide-by-zero exception is triggered by setting ECX to zero with xor ecx,
ecx followed by div ecx at ❸, which divides the EAX register by ECX.
Let’s use the C key in IDA Pro to turn the data at location 401080 into code and see what was hidden using this trick.
00401080                 mov     esp, [esp+8]
00401084                 mov     eax, large fs:0
0040108A                 mov     eax, [eax]
0040108C                 mov     eax, [eax]
0040108E                 mov     large fs:0, eax
00401094                 add     esp, 8
00401097                 push    offset aMysteryCode ; "Mystery Code"
0040109C                 call    printf