Table of Contents for
Practical Malware Analysis
 Practical Malware Analysis
Published by
No Starch Press, 2012
Practical Malware Analysis
Published by
No Starch Press, 2012
- Cover
- Practical Malware Analysis: The Hands-On Guide to Dissecting Malicious Software
- Praise for Practical Malware Analysis
- Warning
- About the Authors
- About the Technical Reviewer
- About the Contributing Authors
- Foreword
- Acknowledgments
- Individual Thanks
- Introduction
- What Is Malware Analysis?
- Prerequisites
- Practical, Hands-On Learning
- What’s in the Book?
- 0. Malware Analysis Primer
- The Goals of Malware Analysis
- Malware Analysis Techniques
- Types of Malware
- General Rules for Malware Analysis
- I. Basic Analysis
- 1. Basic Static Techniques
- Antivirus Scanning: A Useful First Step
- Hashing: A Fingerprint for Malware
- Finding Strings
- Packed and Obfuscated Malware
- Portable Executable File Format
- Linked Libraries and Functions
- Static Analysis in Practice
- The PE File Headers and Sections
- Conclusion
- Labs
- 2. Malware Analysis in Virtual Machines
- The Structure of a Virtual Machine
- Creating Your Malware Analysis Machine
- Using Your Malware Analysis Machine
- The Risks of Using VMware for Malware Analysis
- Record/Replay: Running Your Computer in Reverse
- Conclusion
- 3. Basic Dynamic Analysis
- Sandboxes: The Quick-and-Dirty Approach
- Running Malware
- Monitoring with Process Monitor
- Viewing Processes with Process Explorer
- Comparing Registry Snapshots with Regshot
- Faking a Network
- Packet Sniffing with Wireshark
- Using INetSim
- Basic Dynamic Tools in Practice
- Conclusion
- Labs
- II. Advanced Static Analysis
- 4. A Crash Course in x86 Disassembly
- Levels of Abstraction
- Reverse-Engineering
- The x86 Architecture
- Conclusion
- 5. IDA Pro
- Loading an Executable
- The IDA Pro Interface
- Using Cross-References
- Analyzing Functions
- Using Graphing Options
- Enhancing Disassembly
- Extending IDA with Plug-ins
- Conclusion
- Labs
- 6. Recognizing C Code Constructs in Assembly
- Global vs. Local Variables
- Disassembling Arithmetic Operations
- Recognizing if Statements
- Recognizing Loops
- Understanding Function Call Conventions
- Analyzing switch Statements
- Disassembling Arrays
- Identifying Structs
- Analyzing Linked List Traversal
- Conclusion
- Labs
- 7. Analyzing Malicious Windows Programs
- The Windows API
- The Windows Registry
- Networking APIs
- Following Running Malware
- Kernel vs. User Mode
- The Native API
- Conclusion
- Labs
- III. Advanced Dynamic Analysis
- 8. Debugging
- Source-Level vs. Assembly-Level Debuggers
- Kernel vs. User-Mode Debugging
- Using a Debugger
- Exceptions
- Modifying Execution with a Debugger
- Modifying Program Execution in Practice
- Conclusion
- 9. OllyDbg
- Loading Malware
- The OllyDbg Interface
- Memory Map
- Viewing Threads and Stacks
- Executing Code
- Breakpoints
- Loading DLLs
- Tracing
- Exception Handling
- Patching
- Analyzing Shellcode
- Assistance Features
- Plug-ins
- Scriptable Debugging
- Conclusion
- Labs
- 10. Kernel Debugging with WinDbg
- Drivers and Kernel Code
- Setting Up Kernel Debugging
- Using WinDbg
- Microsoft Symbols
- Kernel Debugging in Practice
- Rootkits
- Loading Drivers
- Kernel Issues for Windows Vista, Windows 7, and x64 Versions
- Conclusion
- Labs
- IV. Malware Functionality
- 11. Malware Behavior
- Downloaders and Launchers
- Backdoors
- Credential Stealers
- Persistence Mechanisms
- Privilege Escalation
- Covering Its Tracks—User-Mode Rootkits
- Conclusion
- Labs
- 12. Covert Malware Launching
- Launchers
- Process Injection
- Process Replacement
- Hook Injection
- Detours
- APC Injection
- Conclusion
- Labs
- 13. Data Encoding
- The Goal of Analyzing Encoding Algorithms
- Simple Ciphers
- Common Cryptographic Algorithms
- Custom Encoding
- Decoding
- Conclusion
- Labs
- 14. Malware-Focused Network Signatures
- Network Countermeasures
- Safely Investigate an Attacker Online
- Content-Based Network Countermeasures
- Combining Dynamic and Static Analysis Techniques
- Understanding the Attacker’s Perspective
- Conclusion
- Labs
- V. Anti-Reverse-Engineering
- 15. Anti-Disassembly
- Understanding Anti-Disassembly
- Defeating Disassembly Algorithms
- Anti-Disassembly Techniques
- Obscuring Flow Control
- Thwarting Stack-Frame Analysis
- Conclusion
- Labs
- 16. Anti-Debugging
- Windows Debugger Detection
- Identifying Debugger Behavior
- Interfering with Debugger Functionality
- Debugger Vulnerabilities
- Conclusion
- Labs
- 17. Anti-Virtual Machine Techniques
- VMware Artifacts
- Vulnerable Instructions
- Tweaking Settings
- Escaping the Virtual Machine
- Conclusion
- Labs
- 18. Packers and Unpacking
- Packer Anatomy
- Identifying Packed Programs
- Unpacking Options
- Automated Unpacking
- Manual Unpacking
- Tips and Tricks for Common Packers
- Analyzing Without Fully Unpacking
- Packed DLLs
- Conclusion
- Labs
- VI. Special Topics
- 19. Shellcode Analysis
- Loading Shellcode for Analysis
- Position-Independent Code
- Identifying Execution Location
- Manual Symbol Resolution
- A Full Hello World Example
- Shellcode Encodings
- NOP Sleds
- Finding Shellcode
- Conclusion
- Labs
- 20. C++ Analysis
- Object-Oriented Programming
- Virtual vs. Nonvirtual Functions
- Creating and Destroying Objects
- Conclusion
- Labs
- 21. 64-Bit Malware
- Why 64-Bit Malware?
- Differences in x64 Architecture
- Windows 32-Bit on Windows 64-Bit
- 64-Bit Hints at Malware Functionality
- Conclusion
- Labs
- A. Important Windows Functions
- B. Tools for Malware Analysis
- C. Solutions to Labs
- Lab 1-1 Solutions
- Lab 1-2 Solutions
- Lab 1-3 Solutions
- Lab 1-4 Solutions
- Lab 3-1 Solutions
- Lab 3-2 Solutions
- Lab 3-3 Solutions
- Lab 3-4 Solutions
- Lab 5-1 Solutions
- Lab 6-1 Solutions
- Lab 6-2 Solutions
- Lab 6-3 Solutions
- Lab 6-4 Solutions
- Lab 7-1 Solutions
- Lab 7-2 Solutions
- Lab 7-3 Solutions
- Lab 9-1 Solutions
- Lab 9-2 Solutions
- Lab 9-3 Solutions
- Lab 10-1 Solutions
- Lab 10-2 Solutions
- Lab 10-3 Solutions
- Lab 11-1 Solutions
- Lab 11-2 Solutions
- Lab 11-3 Solutions
- Lab 12-1 Solutions
- Lab 12-2 Solutions
- Lab 12-3 Solutions
- Lab 12-4 Solutions
- Lab 13-1 Solutions
- Lab 13-2 Solutions
- Lab 13-3 Solutions
- Lab 14-1 Solutions
- Lab 14-2 Solutions
- Lab 14-3 Solutions
- Lab 15-1 Solutions
- Lab 15-2 Solutions
- Lab 15-3 Solutions
- Lab 16-1 Solutions
- Lab 16-2 Solutions
- Lab 16-3 Solutions
- Lab 17-1 Solutions
- Lab 17-2 Solutions
- Lab 17-3 Solutions
- Lab 18-1 Solutions
- Lab 18-2 Solutions
- Lab 18-3 Solutions
- Lab 18-4 Solutions
- Lab 18-5 Solutions
- Lab 19-1 Solutions
- Lab 19-2 Solutions
- Lab 19-3 Solutions
- Lab 20-1 Solutions
- Lab 20-2 Solutions
- Lab 20-3 Solutions
- Lab 21-1 Solutions
- Lab 21-2 Solutions
- Index
- Index
- Index
- Index
- Index
- Index
- Index
- Index
- Index
- Index
- Index
- Index
- Index
- Index
- Index
- Index
- Index
- Index
- Index
- Index
- Index
- Index
- Index
- Index
- Index
- Index
- Index
- Updates
- About the Authors
- Copyright
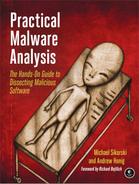
After you load a program into IDA Pro, you will see the disassembly window, as shown in Figure 5-2. This will be your primary space for manipulating and analyzing binaries, and it’s where the assembly code resides.
You can display the disassembly window in one of two modes: graph (the default, shown in Figure 5-2) and text. To switch between modes, press the spacebar.
In graph mode, IDA Pro excludes certain information that we recommend you display, such as line numbers and operation codes. To change these options, select Options ▶ General, and then select Line prefixes and set the Number of Opcode Bytes to 6. Because most instructions contain 6 or fewer bytes, this setting will allow you to see the memory locations and opcode values for each instruction in the code listing. (If these settings make everything scroll off the screen to the right, try setting the Instruction Indentation to 8.)
In graph mode, the color and direction of the arrows help show the program’s flow during analysis. The arrow’s color tells you whether the path is based on a particular decision having been made: red if a conditional jump is not taken, green if the jump is taken, and blue for an unconditional jump. The arrow direction shows the program’s flow; upward arrows typically denote a loop situation. Highlighting text in graph mode highlights every instance of that text in the disassembly window.
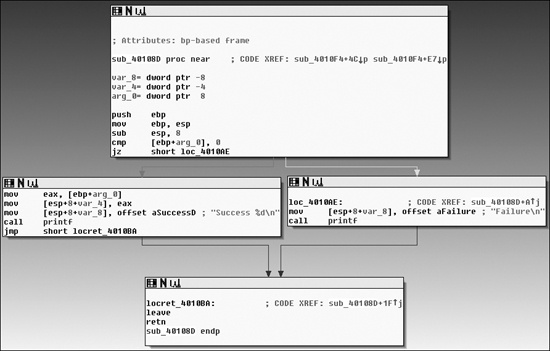
The text mode of the disassembly window is a more traditional view, and you must use it to
view data regions of a binary. Figure 5-3 displays
the text mode view of a disassembled function. It displays the memory address (0040105B) and section name (.text) in
which the opcodes (83EC18) will reside in memory ❶.
The left portion of the text-mode display is known as the arrows window and shows the program’s nonlinear flow. Solid lines mark unconditional jumps, and dashed lines mark conditional jumps. Arrows facing up indicate a loop. The example includes the stack layout for the function at ❷ and a comment (beginning with a semicolon) that was automatically added by IDA Pro ❸.
Several other IDA Pro windows highlight particular items in an executable. The following are the most significant for our purposes.
Functions window. Lists all functions in the executable and shows the length of each. You can sort by function length and filter for large, complicated functions that are likely to be interesting, while excluding tiny functions in the process. This window also associates flags with each function (F, L, S, and so on), the most useful of which, L, indicates library functions. The L flag can save you time during analysis, because you can identify and skip these compiler-generated functions.
Names window. Lists every address with a name, including functions, named code, named data, and strings.
Strings window. Shows all strings. By default, this list shows only ASCII strings longer than five characters. You can change this by right-clicking in the Strings window and selecting Setup.
Imports window. Lists all imports for a file.
Exports window. Lists all the exported functions for a file. This window is useful when you’re analyzing DLLs.
Structures window. Lists the layout of all active data structures. The window also provides you the ability to create your own data structures for use as memory layout templates.
These windows also offer a cross-reference feature that is particularly useful in locating interesting code. For example, to find all code locations that call an imported function, you could use the import window, double-click the imported function of interest, and then use the cross-reference feature to locate the import call in the code listing.
The IDA Pro interface is so rich that, after pressing a few keys or clicking something, you may find it impossible to navigate. To return to the default view, choose Windows ▶ Reset Desktop. Choosing this option won’t undo any labeling or disassembly you’ve done; it will simply restore any windows and GUI elements to their defaults.
By the same token, if you’ve modified the window and you like what you see, you can save the new view by selecting Windows ▶ Save desktop.
As we just noted, IDA Pro can be tricky to navigate. Many windows are linked to the disassembly window. For example, double-clicking an entry within the Imports window or Strings window will take you directly to that entry.
Another way to navigate IDA Pro is to use the links within the disassembly window, such as the links shown in Example 5-1. Double-clicking any of these links ❶ will display the target location in the disassembly window.
Example 5-1. Navigational links within the disassembly window
00401075        jnz     short ❶ loc_40107E
00401077        mov     [ebp+var_10], 1
0040107E loc_40107E:                  ; CODE XREF: ❶ ❷ sub_401040+35j
0040107E        cmp     [ebp+var_C], 0
00401082        jnz     short ❶ loc_401097
00401084        mov     eax, [ebp+var_4]
00401087        mov     [esp+18h+var_14], eax
0040108B        mov     [esp+18h+var_18], offset ❶ aPrintNumberD ; "Print Number= %d\n"
00401092        call   ❶printf
00401097        call   ❶sub_4010A0
The following are the most common types of links:
Sub links are links to the start of functions such as
printfandsub_4010A0.Loc links are links to jump destinations such as
loc_40107Eandloc_401097.Offset links are links to an offset in memory.
Cross-references (shown at ❷ in the listing) are
useful for jumping the display to the referencing location: 0x401075 in this example. Because
strings are typically references, they are also navigational links. For example, aPrintNumberD can be used to jump the display to where that string is
defined in memory.
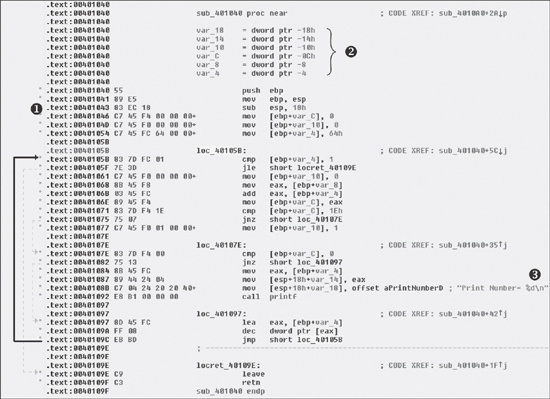
IDA Pro’s forward and back buttons, shown in Figure 5-4, make it easy to move through your history, just as you would move through a history of web pages in a browser. Each time you navigate to a new location within the disassembly window, that location is added to your history.
The horizontal color band at the base of the toolbar is the navigation band, which presents a color-coded linear view of the loaded binary’s address space. The colors offer insight into the file contents at that location in the file as follows:
Light blue is library code as recognized by FLIRT.
Red is compiler-generated code.
Dark blue is user-written code.
You should perform malware analysis in the dark-blue region. If you start getting lost in messy code, the navigational band can help you get back on track. IDA Pro’s default colors for data are pink for imports, gray for defined data, and brown for undefined data.
To jump to any virtual memory address, simply press the G key on your keyboard while in the
disassembly window. A dialog box appears, asking for a virtual memory address or named location,
such as sub_401730 or printf.
To jump to a raw file offset, choose Jump ▶ Jump to File Offset. For example, if you’re viewing a PE file in a hex editor and you see something interesting, such as a string or shellcode, you can use this feature to get to that raw offset, because when the file is loaded into IDA Pro, it will be mapped as though it had been loaded by the OS loader.
Selecting Search from the top menu will display many options for moving the cursor in the disassembly window:
Choose Search ▶ Next Code to move the cursor to the next location containing an instruction you specify.
Choose Search ▶ Text to search the entire disassembly window for a specific string.
Choose Search ▶ Sequence of Bytes to perform a binary search in the hex view window for a certain byte order. This option can be useful when you’re searching for specific data or opcode combinations.
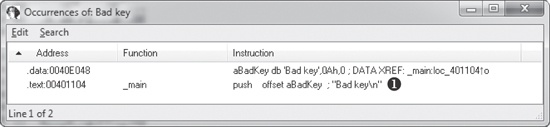
The following example displays the command-line analysis of the
password.exe binary. This malware requires a password to continue running, and
you can see that it prints the string Bad key after we enter an
invalid password (test).
C:\>password.exeEnter password for this Malware:testBad key
We then pull this binary into IDA Pro and see how we can use the search feature and links to
unlock the program. We begin by searching for all occurrences of the Bad
key string, as shown in Figure 5-5. We notice that Bad key is used at 0x401104 ❶,
so we jump to that location in the disassembly window by double-clicking the entry in the search
window.
The disassembly listing around the location of 0x401104 is shown next. Looking through the
listing, before "Bad key\n", we see a comparison at 0x4010F1,
which tests the result of a strcmp. One of the parameters to the
strcmp is the string, and likely password, $mab.
004010E0        push    offset aMab     ; "$mab"
004010E5        lea     ecx, [ebp+var_1C]
004010E8        push    ecx
004010E9        call    strcmp
004010EE        add     esp, 8
004010F1        test    eax, eax
004010F3        jnz     short loc_401104
004010F5        push    offset aKeyAccepted ; "Key Accepted!\n"
004010FA        call    printf
004010FF        add     esp, 4
00401102        jmp     short loc_401118
00401104 loc_401104                    ; CODE XREF: _main+53j
00401104        push    offset aBadKey  ; "Bad key\n"
00401109        call    printf
The next example shows the result of entering the password we discovered, $mab, and the program prints a different result.
C:\>password.exeEnter password for this Malware:$mabKey Accepted! The malware has been unlocked
This example demonstrates how quickly you can use the search feature and links to get information about a binary.