Table of Contents for
Practical Malware Analysis
 Practical Malware Analysis
Published by
No Starch Press, 2012
Practical Malware Analysis
Published by
No Starch Press, 2012
- Cover
- Practical Malware Analysis: The Hands-On Guide to Dissecting Malicious Software
- Praise for Practical Malware Analysis
- Warning
- About the Authors
- About the Technical Reviewer
- About the Contributing Authors
- Foreword
- Acknowledgments
- Individual Thanks
- Introduction
- What Is Malware Analysis?
- Prerequisites
- Practical, Hands-On Learning
- What’s in the Book?
- 0. Malware Analysis Primer
- The Goals of Malware Analysis
- Malware Analysis Techniques
- Types of Malware
- General Rules for Malware Analysis
- I. Basic Analysis
- 1. Basic Static Techniques
- Antivirus Scanning: A Useful First Step
- Hashing: A Fingerprint for Malware
- Finding Strings
- Packed and Obfuscated Malware
- Portable Executable File Format
- Linked Libraries and Functions
- Static Analysis in Practice
- The PE File Headers and Sections
- Conclusion
- Labs
- 2. Malware Analysis in Virtual Machines
- The Structure of a Virtual Machine
- Creating Your Malware Analysis Machine
- Using Your Malware Analysis Machine
- The Risks of Using VMware for Malware Analysis
- Record/Replay: Running Your Computer in Reverse
- Conclusion
- 3. Basic Dynamic Analysis
- Sandboxes: The Quick-and-Dirty Approach
- Running Malware
- Monitoring with Process Monitor
- Viewing Processes with Process Explorer
- Comparing Registry Snapshots with Regshot
- Faking a Network
- Packet Sniffing with Wireshark
- Using INetSim
- Basic Dynamic Tools in Practice
- Conclusion
- Labs
- II. Advanced Static Analysis
- 4. A Crash Course in x86 Disassembly
- Levels of Abstraction
- Reverse-Engineering
- The x86 Architecture
- Conclusion
- 5. IDA Pro
- Loading an Executable
- The IDA Pro Interface
- Using Cross-References
- Analyzing Functions
- Using Graphing Options
- Enhancing Disassembly
- Extending IDA with Plug-ins
- Conclusion
- Labs
- 6. Recognizing C Code Constructs in Assembly
- Global vs. Local Variables
- Disassembling Arithmetic Operations
- Recognizing if Statements
- Recognizing Loops
- Understanding Function Call Conventions
- Analyzing switch Statements
- Disassembling Arrays
- Identifying Structs
- Analyzing Linked List Traversal
- Conclusion
- Labs
- 7. Analyzing Malicious Windows Programs
- The Windows API
- The Windows Registry
- Networking APIs
- Following Running Malware
- Kernel vs. User Mode
- The Native API
- Conclusion
- Labs
- III. Advanced Dynamic Analysis
- 8. Debugging
- Source-Level vs. Assembly-Level Debuggers
- Kernel vs. User-Mode Debugging
- Using a Debugger
- Exceptions
- Modifying Execution with a Debugger
- Modifying Program Execution in Practice
- Conclusion
- 9. OllyDbg
- Loading Malware
- The OllyDbg Interface
- Memory Map
- Viewing Threads and Stacks
- Executing Code
- Breakpoints
- Loading DLLs
- Tracing
- Exception Handling
- Patching
- Analyzing Shellcode
- Assistance Features
- Plug-ins
- Scriptable Debugging
- Conclusion
- Labs
- 10. Kernel Debugging with WinDbg
- Drivers and Kernel Code
- Setting Up Kernel Debugging
- Using WinDbg
- Microsoft Symbols
- Kernel Debugging in Practice
- Rootkits
- Loading Drivers
- Kernel Issues for Windows Vista, Windows 7, and x64 Versions
- Conclusion
- Labs
- IV. Malware Functionality
- 11. Malware Behavior
- Downloaders and Launchers
- Backdoors
- Credential Stealers
- Persistence Mechanisms
- Privilege Escalation
- Covering Its Tracks—User-Mode Rootkits
- Conclusion
- Labs
- 12. Covert Malware Launching
- Launchers
- Process Injection
- Process Replacement
- Hook Injection
- Detours
- APC Injection
- Conclusion
- Labs
- 13. Data Encoding
- The Goal of Analyzing Encoding Algorithms
- Simple Ciphers
- Common Cryptographic Algorithms
- Custom Encoding
- Decoding
- Conclusion
- Labs
- 14. Malware-Focused Network Signatures
- Network Countermeasures
- Safely Investigate an Attacker Online
- Content-Based Network Countermeasures
- Combining Dynamic and Static Analysis Techniques
- Understanding the Attacker’s Perspective
- Conclusion
- Labs
- V. Anti-Reverse-Engineering
- 15. Anti-Disassembly
- Understanding Anti-Disassembly
- Defeating Disassembly Algorithms
- Anti-Disassembly Techniques
- Obscuring Flow Control
- Thwarting Stack-Frame Analysis
- Conclusion
- Labs
- 16. Anti-Debugging
- Windows Debugger Detection
- Identifying Debugger Behavior
- Interfering with Debugger Functionality
- Debugger Vulnerabilities
- Conclusion
- Labs
- 17. Anti-Virtual Machine Techniques
- VMware Artifacts
- Vulnerable Instructions
- Tweaking Settings
- Escaping the Virtual Machine
- Conclusion
- Labs
- 18. Packers and Unpacking
- Packer Anatomy
- Identifying Packed Programs
- Unpacking Options
- Automated Unpacking
- Manual Unpacking
- Tips and Tricks for Common Packers
- Analyzing Without Fully Unpacking
- Packed DLLs
- Conclusion
- Labs
- VI. Special Topics
- 19. Shellcode Analysis
- Loading Shellcode for Analysis
- Position-Independent Code
- Identifying Execution Location
- Manual Symbol Resolution
- A Full Hello World Example
- Shellcode Encodings
- NOP Sleds
- Finding Shellcode
- Conclusion
- Labs
- 20. C++ Analysis
- Object-Oriented Programming
- Virtual vs. Nonvirtual Functions
- Creating and Destroying Objects
- Conclusion
- Labs
- 21. 64-Bit Malware
- Why 64-Bit Malware?
- Differences in x64 Architecture
- Windows 32-Bit on Windows 64-Bit
- 64-Bit Hints at Malware Functionality
- Conclusion
- Labs
- A. Important Windows Functions
- B. Tools for Malware Analysis
- C. Solutions to Labs
- Lab 1-1 Solutions
- Lab 1-2 Solutions
- Lab 1-3 Solutions
- Lab 1-4 Solutions
- Lab 3-1 Solutions
- Lab 3-2 Solutions
- Lab 3-3 Solutions
- Lab 3-4 Solutions
- Lab 5-1 Solutions
- Lab 6-1 Solutions
- Lab 6-2 Solutions
- Lab 6-3 Solutions
- Lab 6-4 Solutions
- Lab 7-1 Solutions
- Lab 7-2 Solutions
- Lab 7-3 Solutions
- Lab 9-1 Solutions
- Lab 9-2 Solutions
- Lab 9-3 Solutions
- Lab 10-1 Solutions
- Lab 10-2 Solutions
- Lab 10-3 Solutions
- Lab 11-1 Solutions
- Lab 11-2 Solutions
- Lab 11-3 Solutions
- Lab 12-1 Solutions
- Lab 12-2 Solutions
- Lab 12-3 Solutions
- Lab 12-4 Solutions
- Lab 13-1 Solutions
- Lab 13-2 Solutions
- Lab 13-3 Solutions
- Lab 14-1 Solutions
- Lab 14-2 Solutions
- Lab 14-3 Solutions
- Lab 15-1 Solutions
- Lab 15-2 Solutions
- Lab 15-3 Solutions
- Lab 16-1 Solutions
- Lab 16-2 Solutions
- Lab 16-3 Solutions
- Lab 17-1 Solutions
- Lab 17-2 Solutions
- Lab 17-3 Solutions
- Lab 18-1 Solutions
- Lab 18-2 Solutions
- Lab 18-3 Solutions
- Lab 18-4 Solutions
- Lab 18-5 Solutions
- Lab 19-1 Solutions
- Lab 19-2 Solutions
- Lab 19-3 Solutions
- Lab 20-1 Solutions
- Lab 20-2 Solutions
- Lab 20-3 Solutions
- Lab 21-1 Solutions
- Lab 21-2 Solutions
- Index
- Index
- Index
- Index
- Index
- Index
- Index
- Index
- Index
- Index
- Index
- Index
- Index
- Index
- Index
- Index
- Index
- Index
- Index
- Index
- Index
- Index
- Index
- Index
- Index
- Index
- Index
- Updates
- About the Authors
- Copyright
The malware checks the status of the
BeingDebugged,ProcessHeap, andNTGlobalFlagflags to determine if it is being run in a debugger.If any of the malware’s anti-debugging techniques succeed, it will terminate and remove itself from disk.
You can manually change the jump flags in OllyDbg during runtime, but doing so will get tedious since this malware checks the memory structures so frequently. Instead, modify the structures the malware checks in memory either manually or by using an OllyDbg plug-in like PhantOm or the Immunity Debugger (ImmDbg) PyCommand
hidedebug.See the detailed analysis for a step-by-step way to dump and modify the structures in OllyDbg.
Both the OllyDbg plug-in PhantOm and the ImmDbg PyCommand
hidedebugwill thwart this malware’s checks.
As noted in the lab description, this malware is the same as Lab09-01.exe, except with anti-debugging techniques. Therefore, a good place to start is either by working through Lab 9-1 Solutions or by reviewing your answers.
When we load this malware into OllyDbg, we see that it attempts to delete itself. Suspecting
that something must be wrong or that this malware is significantly different from Lab 9-1 Solutions, we load Lab16-01.exe into IDA Pro. As shown in
Figure C-59, we notice that the beginning of the
main method appears suspicious because of several accesses of
fs:[30] and calls to a function that IDA Pro identifies as one
that doesn’t return. In fact, most functions recognized by IDA Pro have this suspicious start.
(None of the functions in Lab 9-1 Solutions have this code.)
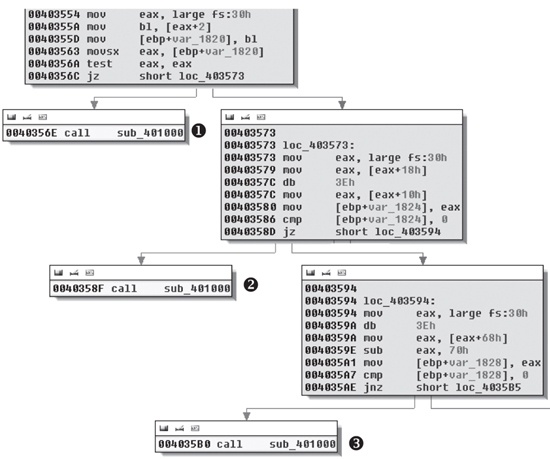
Figure C-59. Anti-debugging checks contained at the beginning of most functions in Lab 16-1 Solutions
We see at ❶, ❷, and ❸ in Figure C-59 that sub_401000 is called and the code stops there (no lines leave the boxes). Since a line
doesn’t leave the box, it means the function probably terminates the program or doesn’t
contain a ret instruction. Each large box in Figure C-59 contains a check that decides whether sub_401000 will be called or the malware will continue to execute
normally. (We’ll analyze each of these checks after we look at sub_401000.)
The function sub_401000 is suspicious because execution
won’t return from it, so we examine it further. Example C-141 shows its final instructions.
Example C-141. Function sub_401000 with code to terminate the malware and
remove it from disk
004010CE         lea     eax, [ebp+Parameters]
004010D4         push    eax                     ; lpParameters
004010D5         push    offset File             ; "cmd.exe"
004010DA         push    0                       ; lpOperation
004010DC         push    0                       ; hwnd
004010DE         call    ds:ShellExecuteA ❶
004010E4         push    0                       ; Code
004010E6         call    _exit ❷
Function sub_401000 ends at ❷ with a call to _exit,
terminating the malware. The call to ShellExecuteA at ❶ removes the malware from disk by launching
cmd.exe using the parameters /c del
Lab16-01.exe. Checking the cross-references to sub_401000, we find 79 of them, most of which come from the anti-debugging code shown in
Figure C-59. Let’s dissect Figure C-59 in more detail.
Example C-142 shows the code in the top box of Figure C-59.
Example C-142. Checking the BeingDebugged flag
00403554         mov     eax, large fs:30h ❶
0040355A         mov     bl, [eax+2] ❷
0040355D         mov     [ebp+var_1820], bl
00403563         movsx   eax, [ebp+var_1820]
0040356A         test    eax, eax
0040356C         jz      short loc_403573 ❸
0040356E         call    sub_401000
As you can see, the PEB structure is loaded into EAX at ❶ using the fs:[30] location, as discussed in Manually Checking Structures. At ❷, the
second byte is accessed and moved into the BL register. At ❸, the code decides whether to call sub_401000 (the
terminate and remove function) or to continue running the malware.
The BeingDebugged flag at offset 2 in the PEB structure is
set to 1 when the process is running inside a debugger, but we need this flag set to 0 in order for
the malware to run normally within a debugger. We can set this byte to 0 either manually or with an
OllyDbg plug-in. Let’s do it manually first.
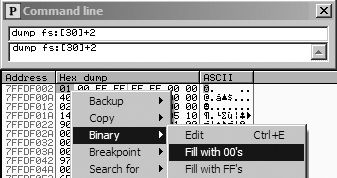
In OllyDbg, make sure you have the Command Line plug-in installed (as discussed in Chapter 9). To launch the plug-in, load the malware in OllyDbg and select Plugins ▸ Command Line. In the command-line window, enter the following command:
dump fs:[30] + 2
This command will dump the BeingDebugged flag into
the dump window. To manually clear the BeingDebugged flag, run
the dump command in the command-line window, as shown in the top
part of Figure C-60. Then right-click the BeingDebugged flag and select Binary ▸ Fill
With 00’s, as shown in the bottom portion of Figure C-60. This sets the flag to 0. With this change, the
BeingDebugged check performed several times at the start of
functions in the malware will no longer call the sub_401000
function.
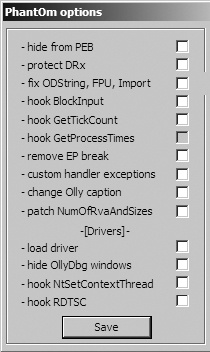
Now let’s try the plug-in approach. The OllyDbg plug-in PhantOm (http://www.woodmann.com/collaborative/tools/index.php/PhantOm) will protect you
from many anti-debug checks used by malware. Download the plug-in and install it by copying it to
your OllyDbg installation directory before launching OllyDbg. Then select Plugins ▸ PhantOm ▸ Options to open the PhantOm Options dialog, as shown in
Figure C-61. Check the first option, Hide from PEB, to set the BeingDebugged flag to 0 the
next time OllyDbg loads malware. (Confirm this by dumping the PEB structure before and after the
plug-in is installed.)
Example C-143 shows the code in the middle box of Figure C-59.
Example C-143. Checking the ProcessHeap flag
00401410 64 A1 30 00 00+        mov     eax, large fs:30h ❶
00401416 8B 40 18               mov     eax, [eax+18h] ❷
00401419                        db      3Eh ❺
00401419 3E 8B 40 10            mov     eax, [eax+10h] ❸
0040141D 89 45 F0               mov     [ebp+var_10], eax
00401420 83 7D F0 00            cmp     [ebp+var_10], 0 ❹
00401424 74 05                  jz      short loc_40142B
00401426 E8 D5 FB FF FF         call    sub_401000
The PEB structure is loaded into EAX at ❶
using fs:[30]. At ❷,
the ProcessHeap structure (offset 0x18 into the PEB) is moved
into EAX, and then the ForceFlags field (offset 0x10 into the
ProcessHeap structure) is moved into EAX at ❸. ForceFlags is compared to 0
at ❹ to decide whether to call sub_401000 or to continue running normally.
An erroneous db 3Eh instruction was added by IDA Pro at
❺. We displayed the opcodes in Example C-142 to show that the 0x3E is included in the next instruction at ❸. If you look at the disassembly in OllyDbg, you won’t see this error.
Note
When you encounter erroneous db instructions, you can ignore them, but you should display opcodes to
confirm that the byte is disassembled properly in an instruction.
The 4-byte ForceFlags field is nonzero when the ProcessHeap structure is created in the debugger, and the ForceFlags field must be 0 in order for the malware to run normally within
a debugger. We need to change it to 0 when debugging, either manually with the OllyDbg Command Line
plug-in or by using the OllyDbg PhantOm plug-in, as with the BeingDebugged flag.
To set the ForceFlags field to 0 manually, launch the
Command Line plug-in by selecting Plugins ▸ Command Line,
and then enter the following command in the window:
dump ds:[fs:[30] + 0x18] + 0x10
The command dumps the ForceFlags field of the ProcessHeap structure into the dump window. Select all 4 bytes of the
ForceFlags field, and then right-click and select Binary ▸ Fill With 00’s to set the 4 bytes to 0.
Note
In Windows 7, offset 0x10 is no longer the ForceFlags field, so this anti-debugging method may end up falsely indicating the
presence of a debugger on newer versions of Windows (post-XP).
Alternatively, use the PhantOm plug-in to protect against the ProcessHeap anti-debugging technique. The PhantOm plug-in will cause this technique to
fail when you start the program with debug heap creation disabled. (You don’t need to modify
the settings as you did for the BeingDebugged flag.)
The code in the lower box of Figure C-59 is shown in Example C-144.
Example C-144. Checking the NTGlobalFlag flag
00403594         mov     eax, large fs:30h ❶
0040359A         db      3Eh ❸
0040359A         mov     eax, [eax+68h] ❷
0040359E         sub     eax, 70h
004035A1         mov     [ebp+var_1828], eax
004035A7         cmp     [ebp+var_1828], 0
004035AE         jnz     short loc_4035B5
004035B0         call    sub_401000
The PEB structure is loaded into EAX at ❶
using fs:[30], and NTGlobalFlag is accessed and moved into EAX at ❷. NTGlobalFlag is compared to 0x70, and a decision
is made whether to call sub_401000 (the terminate and remove
function) or to continue executing normally. The erroneous db 3Eh
added by IDA Pro is seen at ❸, and we ignore it.
The NTGlobalFlag flag at offset 0x68 in the PEB structure
is set to 0x70 when the process is run in a debugger. As with the other flags we’ve discussed,
we need to set this byte to 0, either manually or by using an OllyDbg plug-in.
To set NTGlobalFlag manually, launch the Command Line
plug-in by selecting Plugins ▸ Command Line, and then enter
the following command in the window:
dump fs:[30] + 0x68
This dumps the NTGlobalFlag flag into the dump window. As
with the BeingDebugged flag, select the byte, right-click, and
select Binary ▸ Fill With 00’s to set the byte to
0.
You can use also the OllyDbg plug-in PhantOm to protect yourself from the NTGlobalFlag anti-debugging technique without the need to modify any
settings.
Lab 16-1 Solutions uses three different anti-debugging techniques to attempt to thwart debugger analysis. The malware manually checks structures for telltale signs of debugger usage and performs the same three checks at the start of nearly every subroutine, which makes flipping single jump flags tedious when inside a debugger. As you’ve seen, the easiest way to defeat the malware is to change the structures in memory so that the check fails, and you can make this change either manually or with the PhantOm plug-in for OllyDbg.