Table of Contents for
Practical Malware Analysis
 Practical Malware Analysis
Published by
No Starch Press, 2012
Practical Malware Analysis
Published by
No Starch Press, 2012
- Cover
- Practical Malware Analysis: The Hands-On Guide to Dissecting Malicious Software
- Praise for Practical Malware Analysis
- Warning
- About the Authors
- About the Technical Reviewer
- About the Contributing Authors
- Foreword
- Acknowledgments
- Individual Thanks
- Introduction
- What Is Malware Analysis?
- Prerequisites
- Practical, Hands-On Learning
- What’s in the Book?
- 0. Malware Analysis Primer
- The Goals of Malware Analysis
- Malware Analysis Techniques
- Types of Malware
- General Rules for Malware Analysis
- I. Basic Analysis
- 1. Basic Static Techniques
- Antivirus Scanning: A Useful First Step
- Hashing: A Fingerprint for Malware
- Finding Strings
- Packed and Obfuscated Malware
- Portable Executable File Format
- Linked Libraries and Functions
- Static Analysis in Practice
- The PE File Headers and Sections
- Conclusion
- Labs
- 2. Malware Analysis in Virtual Machines
- The Structure of a Virtual Machine
- Creating Your Malware Analysis Machine
- Using Your Malware Analysis Machine
- The Risks of Using VMware for Malware Analysis
- Record/Replay: Running Your Computer in Reverse
- Conclusion
- 3. Basic Dynamic Analysis
- Sandboxes: The Quick-and-Dirty Approach
- Running Malware
- Monitoring with Process Monitor
- Viewing Processes with Process Explorer
- Comparing Registry Snapshots with Regshot
- Faking a Network
- Packet Sniffing with Wireshark
- Using INetSim
- Basic Dynamic Tools in Practice
- Conclusion
- Labs
- II. Advanced Static Analysis
- 4. A Crash Course in x86 Disassembly
- Levels of Abstraction
- Reverse-Engineering
- The x86 Architecture
- Conclusion
- 5. IDA Pro
- Loading an Executable
- The IDA Pro Interface
- Using Cross-References
- Analyzing Functions
- Using Graphing Options
- Enhancing Disassembly
- Extending IDA with Plug-ins
- Conclusion
- Labs
- 6. Recognizing C Code Constructs in Assembly
- Global vs. Local Variables
- Disassembling Arithmetic Operations
- Recognizing if Statements
- Recognizing Loops
- Understanding Function Call Conventions
- Analyzing switch Statements
- Disassembling Arrays
- Identifying Structs
- Analyzing Linked List Traversal
- Conclusion
- Labs
- 7. Analyzing Malicious Windows Programs
- The Windows API
- The Windows Registry
- Networking APIs
- Following Running Malware
- Kernel vs. User Mode
- The Native API
- Conclusion
- Labs
- III. Advanced Dynamic Analysis
- 8. Debugging
- Source-Level vs. Assembly-Level Debuggers
- Kernel vs. User-Mode Debugging
- Using a Debugger
- Exceptions
- Modifying Execution with a Debugger
- Modifying Program Execution in Practice
- Conclusion
- 9. OllyDbg
- Loading Malware
- The OllyDbg Interface
- Memory Map
- Viewing Threads and Stacks
- Executing Code
- Breakpoints
- Loading DLLs
- Tracing
- Exception Handling
- Patching
- Analyzing Shellcode
- Assistance Features
- Plug-ins
- Scriptable Debugging
- Conclusion
- Labs
- 10. Kernel Debugging with WinDbg
- Drivers and Kernel Code
- Setting Up Kernel Debugging
- Using WinDbg
- Microsoft Symbols
- Kernel Debugging in Practice
- Rootkits
- Loading Drivers
- Kernel Issues for Windows Vista, Windows 7, and x64 Versions
- Conclusion
- Labs
- IV. Malware Functionality
- 11. Malware Behavior
- Downloaders and Launchers
- Backdoors
- Credential Stealers
- Persistence Mechanisms
- Privilege Escalation
- Covering Its Tracks—User-Mode Rootkits
- Conclusion
- Labs
- 12. Covert Malware Launching
- Launchers
- Process Injection
- Process Replacement
- Hook Injection
- Detours
- APC Injection
- Conclusion
- Labs
- 13. Data Encoding
- The Goal of Analyzing Encoding Algorithms
- Simple Ciphers
- Common Cryptographic Algorithms
- Custom Encoding
- Decoding
- Conclusion
- Labs
- 14. Malware-Focused Network Signatures
- Network Countermeasures
- Safely Investigate an Attacker Online
- Content-Based Network Countermeasures
- Combining Dynamic and Static Analysis Techniques
- Understanding the Attacker’s Perspective
- Conclusion
- Labs
- V. Anti-Reverse-Engineering
- 15. Anti-Disassembly
- Understanding Anti-Disassembly
- Defeating Disassembly Algorithms
- Anti-Disassembly Techniques
- Obscuring Flow Control
- Thwarting Stack-Frame Analysis
- Conclusion
- Labs
- 16. Anti-Debugging
- Windows Debugger Detection
- Identifying Debugger Behavior
- Interfering with Debugger Functionality
- Debugger Vulnerabilities
- Conclusion
- Labs
- 17. Anti-Virtual Machine Techniques
- VMware Artifacts
- Vulnerable Instructions
- Tweaking Settings
- Escaping the Virtual Machine
- Conclusion
- Labs
- 18. Packers and Unpacking
- Packer Anatomy
- Identifying Packed Programs
- Unpacking Options
- Automated Unpacking
- Manual Unpacking
- Tips and Tricks for Common Packers
- Analyzing Without Fully Unpacking
- Packed DLLs
- Conclusion
- Labs
- VI. Special Topics
- 19. Shellcode Analysis
- Loading Shellcode for Analysis
- Position-Independent Code
- Identifying Execution Location
- Manual Symbol Resolution
- A Full Hello World Example
- Shellcode Encodings
- NOP Sleds
- Finding Shellcode
- Conclusion
- Labs
- 20. C++ Analysis
- Object-Oriented Programming
- Virtual vs. Nonvirtual Functions
- Creating and Destroying Objects
- Conclusion
- Labs
- 21. 64-Bit Malware
- Why 64-Bit Malware?
- Differences in x64 Architecture
- Windows 32-Bit on Windows 64-Bit
- 64-Bit Hints at Malware Functionality
- Conclusion
- Labs
- A. Important Windows Functions
- B. Tools for Malware Analysis
- C. Solutions to Labs
- Lab 1-1 Solutions
- Lab 1-2 Solutions
- Lab 1-3 Solutions
- Lab 1-4 Solutions
- Lab 3-1 Solutions
- Lab 3-2 Solutions
- Lab 3-3 Solutions
- Lab 3-4 Solutions
- Lab 5-1 Solutions
- Lab 6-1 Solutions
- Lab 6-2 Solutions
- Lab 6-3 Solutions
- Lab 6-4 Solutions
- Lab 7-1 Solutions
- Lab 7-2 Solutions
- Lab 7-3 Solutions
- Lab 9-1 Solutions
- Lab 9-2 Solutions
- Lab 9-3 Solutions
- Lab 10-1 Solutions
- Lab 10-2 Solutions
- Lab 10-3 Solutions
- Lab 11-1 Solutions
- Lab 11-2 Solutions
- Lab 11-3 Solutions
- Lab 12-1 Solutions
- Lab 12-2 Solutions
- Lab 12-3 Solutions
- Lab 12-4 Solutions
- Lab 13-1 Solutions
- Lab 13-2 Solutions
- Lab 13-3 Solutions
- Lab 14-1 Solutions
- Lab 14-2 Solutions
- Lab 14-3 Solutions
- Lab 15-1 Solutions
- Lab 15-2 Solutions
- Lab 15-3 Solutions
- Lab 16-1 Solutions
- Lab 16-2 Solutions
- Lab 16-3 Solutions
- Lab 17-1 Solutions
- Lab 17-2 Solutions
- Lab 17-3 Solutions
- Lab 18-1 Solutions
- Lab 18-2 Solutions
- Lab 18-3 Solutions
- Lab 18-4 Solutions
- Lab 18-5 Solutions
- Lab 19-1 Solutions
- Lab 19-2 Solutions
- Lab 19-3 Solutions
- Lab 20-1 Solutions
- Lab 20-2 Solutions
- Lab 20-3 Solutions
- Lab 21-1 Solutions
- Lab 21-2 Solutions
- Index
- Index
- Index
- Index
- Index
- Index
- Index
- Index
- Index
- Index
- Index
- Index
- Index
- Index
- Index
- Index
- Index
- Index
- Index
- Index
- Index
- Index
- Index
- Index
- Index
- Index
- Index
- Updates
- About the Authors
- Copyright
Process Monitor, or procmon, is an advanced monitoring tool for Windows that provides a way to monitor certain registry, file system, network, process, and thread activity. It combines and enhances the functionality of two legacy tools: FileMon and RegMon.
Although procmon captures a lot of data, it doesn’t capture everything. For example, it
can miss the device driver activity of a user-mode component talking to a rootkit via device I/O
controls, as well as certain GUI calls, such as SetWindowsHookEx.
Although procmon can be a useful tool, it usually should not be used for logging network activity,
because it does not work consistently across Microsoft Windows versions.
Warning
Throughout this chapter, we will use tools to test malware dynamically. When you test malware, be sure to protect your computers and networks by using a virtual machine, as discussed in the previous chapter.
Procmon monitors all system calls it can gather as soon as it is run. Because many system calls exist on a Windows machine (sometimes more than 50,000 events a minute), it’s usually impossible to look through them all. As a result, because procmon uses RAM to log events until it is told to stop capturing, it can crash a virtual machine using all available memory. To avoid this, run procmon for limited periods of time. To stop procmon from capturing events, choose File ▶ Capture Events. Before using procmon for analysis, first clear all currently captured events to remove irrelevant data by choosing Edit ▶ Clear Display. Next, run the subject malware with capture turned on. After a few minutes, you can discontinue event capture.
Procmon displays configurable columns containing information about individual events, including the event’s sequence number, timestamp, name of the process causing the event, event operation, path used by the event, and result of the event. This detailed information can be too long to fit on the screen, or it can be otherwise difficult to read. If you find either to be the case, you can view the full details of a particular event by double-clicking its row.
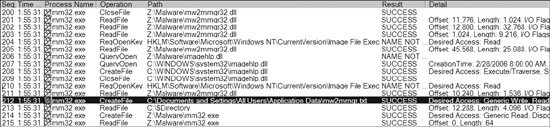
Figure 3-2 shows a collection of procmon events that
occurred on a machine running a piece of malware named mm32.exe. Reading the
Operation column will quickly tell you which operations mm32.exe performed on
this system, including registry and file system accesses. One entry of note is the creation of a
file C:\Documents and Settings\All Users\Application Data\mw2mmgr.txt at
sequence number 212 using CreateFile. The word
SUCCESS in the Result column tells you that this operation was
successful.
It’s not always easy to find information in procmon when you are looking through thousands of events, one by one. That’s where procmon’s filtering capability is key.
You can set procmon to filter on one executable running on the system. This feature is
particularly useful for malware analysis, because you can set a filter on the piece of malware you
are running. You can also filter on individual system calls such as RegSetValue, CreateFile, WriteFile, or other suspicious or destructive calls.
When procmon filtering is turned on, it filters through recorded events only. All recorded events are still available even though the filter shows only a limited display. Setting a filter is not a way to prevent procmon from consuming too much memory.
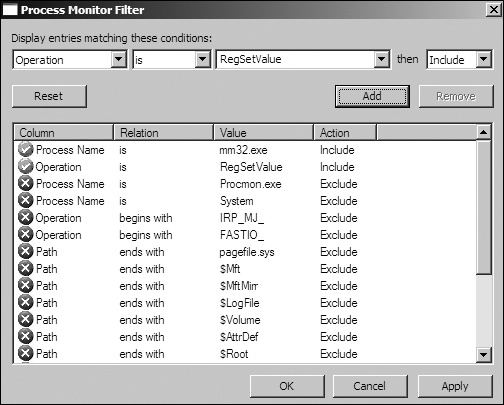
To set a filter, choose Filter ▶ Filter to open the Filter menu, as shown in the top image of Figure 3-3. When setting a filter, first select a column to filter on using the drop-down box at the upper left, above the Reset button. The most important filters for malware analysis are Process Name, Operation, and Detail. Next, select a comparator, choosing from options such as Is, Contains, and Less Than. Finally, choose whether this is a filter to include or exclude from display. Because, by default, the display will show all system calls, it is important to reduce the amount displayed.
Note
Procmon uses some basic filters by default. For example, it contains a filter that excludes procmon.exe and one that excludes the pagefile from logging, because it is accessed often and provides no useful information.
As you can see in the first two rows of Figure 3-3,
we’re filtering on Process Name and Operation. We’ve added a filter on Process Name
equal to mm32.exe that’s active when the Operation is set to RegSetValue.
After you’ve chosen a filter, click Add for each, and
then click Apply. As a result of applying our filters, the
display window shown in the lower image displays only 11 of the 39,351 events, making it easier for
us to see that mm32.exe performed a RegSetValue of registry key HKLM\SOFTWARE\Microsoft\Windows\CurrentVersion\Run\Sys32V2Controller (sequence number 3 using RegSetValue). Double-clicking this RegSetValue event
will reveal the data written to this location, which is the current path to the malware.
If the malware extracted another executable and ran it, don’t worry, because that information is still there. Remember that the filter controls only the display. All of the system calls that occurred when you ran the malware are captured, including system calls from malware that was extracted by the original executable. If you see any malware extracted, change the filter to display the extracted name, and then click Apply. The events related to the extracted malware will be displayed.
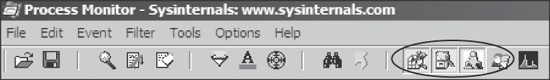
Procmon provides helpful automatic filters on its toolbar. The four filters circled in Figure 3-4 filter by the following categories:
Registry. By examining registry operations, you can tell how a piece of malware installs itself in the registry.
File system. Exploring file system interaction can show all files that the malware creates or configuration files it uses.
Process activity. Investigating process activity can tell you whether the malware spawned additional processes.
Network. Identifying network connections can show you any ports on which the malware is listening.
All four filters are selected by default. To turn off a filter, simply click the icon in the toolbar corresponding to the category.
Note
If your malware runs at boot time, use procmon’s boot logging options to install procmon as a startup driver to capture startup events.
Analysis of procmon’s recorded events takes practice and patience, since many events are simply part of the standard way that executables start up. The more you use procmon, the easier you will find it to quickly review the event listing.