Table of Contents for
Practical Malware Analysis
 Practical Malware Analysis
Published by
No Starch Press, 2012
Practical Malware Analysis
Published by
No Starch Press, 2012
- Cover
- Practical Malware Analysis: The Hands-On Guide to Dissecting Malicious Software
- Praise for Practical Malware Analysis
- Warning
- About the Authors
- About the Technical Reviewer
- About the Contributing Authors
- Foreword
- Acknowledgments
- Individual Thanks
- Introduction
- What Is Malware Analysis?
- Prerequisites
- Practical, Hands-On Learning
- What’s in the Book?
- 0. Malware Analysis Primer
- The Goals of Malware Analysis
- Malware Analysis Techniques
- Types of Malware
- General Rules for Malware Analysis
- I. Basic Analysis
- 1. Basic Static Techniques
- Antivirus Scanning: A Useful First Step
- Hashing: A Fingerprint for Malware
- Finding Strings
- Packed and Obfuscated Malware
- Portable Executable File Format
- Linked Libraries and Functions
- Static Analysis in Practice
- The PE File Headers and Sections
- Conclusion
- Labs
- 2. Malware Analysis in Virtual Machines
- The Structure of a Virtual Machine
- Creating Your Malware Analysis Machine
- Using Your Malware Analysis Machine
- The Risks of Using VMware for Malware Analysis
- Record/Replay: Running Your Computer in Reverse
- Conclusion
- 3. Basic Dynamic Analysis
- Sandboxes: The Quick-and-Dirty Approach
- Running Malware
- Monitoring with Process Monitor
- Viewing Processes with Process Explorer
- Comparing Registry Snapshots with Regshot
- Faking a Network
- Packet Sniffing with Wireshark
- Using INetSim
- Basic Dynamic Tools in Practice
- Conclusion
- Labs
- II. Advanced Static Analysis
- 4. A Crash Course in x86 Disassembly
- Levels of Abstraction
- Reverse-Engineering
- The x86 Architecture
- Conclusion
- 5. IDA Pro
- Loading an Executable
- The IDA Pro Interface
- Using Cross-References
- Analyzing Functions
- Using Graphing Options
- Enhancing Disassembly
- Extending IDA with Plug-ins
- Conclusion
- Labs
- 6. Recognizing C Code Constructs in Assembly
- Global vs. Local Variables
- Disassembling Arithmetic Operations
- Recognizing if Statements
- Recognizing Loops
- Understanding Function Call Conventions
- Analyzing switch Statements
- Disassembling Arrays
- Identifying Structs
- Analyzing Linked List Traversal
- Conclusion
- Labs
- 7. Analyzing Malicious Windows Programs
- The Windows API
- The Windows Registry
- Networking APIs
- Following Running Malware
- Kernel vs. User Mode
- The Native API
- Conclusion
- Labs
- III. Advanced Dynamic Analysis
- 8. Debugging
- Source-Level vs. Assembly-Level Debuggers
- Kernel vs. User-Mode Debugging
- Using a Debugger
- Exceptions
- Modifying Execution with a Debugger
- Modifying Program Execution in Practice
- Conclusion
- 9. OllyDbg
- Loading Malware
- The OllyDbg Interface
- Memory Map
- Viewing Threads and Stacks
- Executing Code
- Breakpoints
- Loading DLLs
- Tracing
- Exception Handling
- Patching
- Analyzing Shellcode
- Assistance Features
- Plug-ins
- Scriptable Debugging
- Conclusion
- Labs
- 10. Kernel Debugging with WinDbg
- Drivers and Kernel Code
- Setting Up Kernel Debugging
- Using WinDbg
- Microsoft Symbols
- Kernel Debugging in Practice
- Rootkits
- Loading Drivers
- Kernel Issues for Windows Vista, Windows 7, and x64 Versions
- Conclusion
- Labs
- IV. Malware Functionality
- 11. Malware Behavior
- Downloaders and Launchers
- Backdoors
- Credential Stealers
- Persistence Mechanisms
- Privilege Escalation
- Covering Its Tracks—User-Mode Rootkits
- Conclusion
- Labs
- 12. Covert Malware Launching
- Launchers
- Process Injection
- Process Replacement
- Hook Injection
- Detours
- APC Injection
- Conclusion
- Labs
- 13. Data Encoding
- The Goal of Analyzing Encoding Algorithms
- Simple Ciphers
- Common Cryptographic Algorithms
- Custom Encoding
- Decoding
- Conclusion
- Labs
- 14. Malware-Focused Network Signatures
- Network Countermeasures
- Safely Investigate an Attacker Online
- Content-Based Network Countermeasures
- Combining Dynamic and Static Analysis Techniques
- Understanding the Attacker’s Perspective
- Conclusion
- Labs
- V. Anti-Reverse-Engineering
- 15. Anti-Disassembly
- Understanding Anti-Disassembly
- Defeating Disassembly Algorithms
- Anti-Disassembly Techniques
- Obscuring Flow Control
- Thwarting Stack-Frame Analysis
- Conclusion
- Labs
- 16. Anti-Debugging
- Windows Debugger Detection
- Identifying Debugger Behavior
- Interfering with Debugger Functionality
- Debugger Vulnerabilities
- Conclusion
- Labs
- 17. Anti-Virtual Machine Techniques
- VMware Artifacts
- Vulnerable Instructions
- Tweaking Settings
- Escaping the Virtual Machine
- Conclusion
- Labs
- 18. Packers and Unpacking
- Packer Anatomy
- Identifying Packed Programs
- Unpacking Options
- Automated Unpacking
- Manual Unpacking
- Tips and Tricks for Common Packers
- Analyzing Without Fully Unpacking
- Packed DLLs
- Conclusion
- Labs
- VI. Special Topics
- 19. Shellcode Analysis
- Loading Shellcode for Analysis
- Position-Independent Code
- Identifying Execution Location
- Manual Symbol Resolution
- A Full Hello World Example
- Shellcode Encodings
- NOP Sleds
- Finding Shellcode
- Conclusion
- Labs
- 20. C++ Analysis
- Object-Oriented Programming
- Virtual vs. Nonvirtual Functions
- Creating and Destroying Objects
- Conclusion
- Labs
- 21. 64-Bit Malware
- Why 64-Bit Malware?
- Differences in x64 Architecture
- Windows 32-Bit on Windows 64-Bit
- 64-Bit Hints at Malware Functionality
- Conclusion
- Labs
- A. Important Windows Functions
- B. Tools for Malware Analysis
- C. Solutions to Labs
- Lab 1-1 Solutions
- Lab 1-2 Solutions
- Lab 1-3 Solutions
- Lab 1-4 Solutions
- Lab 3-1 Solutions
- Lab 3-2 Solutions
- Lab 3-3 Solutions
- Lab 3-4 Solutions
- Lab 5-1 Solutions
- Lab 6-1 Solutions
- Lab 6-2 Solutions
- Lab 6-3 Solutions
- Lab 6-4 Solutions
- Lab 7-1 Solutions
- Lab 7-2 Solutions
- Lab 7-3 Solutions
- Lab 9-1 Solutions
- Lab 9-2 Solutions
- Lab 9-3 Solutions
- Lab 10-1 Solutions
- Lab 10-2 Solutions
- Lab 10-3 Solutions
- Lab 11-1 Solutions
- Lab 11-2 Solutions
- Lab 11-3 Solutions
- Lab 12-1 Solutions
- Lab 12-2 Solutions
- Lab 12-3 Solutions
- Lab 12-4 Solutions
- Lab 13-1 Solutions
- Lab 13-2 Solutions
- Lab 13-3 Solutions
- Lab 14-1 Solutions
- Lab 14-2 Solutions
- Lab 14-3 Solutions
- Lab 15-1 Solutions
- Lab 15-2 Solutions
- Lab 15-3 Solutions
- Lab 16-1 Solutions
- Lab 16-2 Solutions
- Lab 16-3 Solutions
- Lab 17-1 Solutions
- Lab 17-2 Solutions
- Lab 17-3 Solutions
- Lab 18-1 Solutions
- Lab 18-2 Solutions
- Lab 18-3 Solutions
- Lab 18-4 Solutions
- Lab 18-5 Solutions
- Lab 19-1 Solutions
- Lab 19-2 Solutions
- Lab 19-3 Solutions
- Lab 20-1 Solutions
- Lab 20-2 Solutions
- Lab 20-3 Solutions
- Lab 21-1 Solutions
- Lab 21-2 Solutions
- Index
- Index
- Index
- Index
- Index
- Index
- Index
- Index
- Index
- Index
- Index
- Index
- Index
- Index
- Index
- Index
- Index
- Index
- Index
- Index
- Index
- Index
- Index
- Index
- Index
- Index
- Index
- Updates
- About the Authors
- Copyright
As discussed in Chapter 8, there are several different types of breakpoints, and OllyDbg supports all of those types. By default, it uses software breakpoints, but you can also use hardware breakpoints. Additionally, you can set conditional breakpoints, as well as set breakpoints on memory.
You can add or remove a breakpoint by selecting the instruction in the disassembler window and pressing F2. You can view the active breakpoints in a program by selecting View ▶ Breakpoints or clicking the B icon in the toolbar.
After you close or terminate a debugged program, OllyDbg will typically save the breakpoint locations you set, which will enable you to debug the program again with the same breakpoints (so you don’t need to set the breakpoints again). Table 9-2 shows a complete listing of OllyDbg’s breakpoints.
Table 9-2. OllyDbg Breakpoint Options
Function | Right-click menu selection | Hotkey |
|---|---|---|
Software breakpoint | Breakpoint ▸ Toggle | F2 |
Conditional breakpoint | Breakpoint ▸ Conditional | SHIFT-F2 |
Hardware breakpoint | Breakpoint ▸ Hardware, on Execution | |
Memory breakpoint on access (read, write, or execute) | Breakpoint ▸ Memory, on Access | F2 (select memory) |
Memory breakpoint on write | Breakpoint ▸ Memory, on Write |
Software breakpoints are particularly useful when debugging a string decoder function. Recall
from Chapter 1 that strings can be a useful way to gain insight into
a program’s functionality, which is why malware authors often try to obfuscate strings. When
malware authors do this, they often use a string decoder, which is called before each string is
used. Example 9-2 shows an example with calls to String_Decoder after obfuscated data is pushed on the stack.
Example 9-2. A string decoding breakpoint
push offset "4NNpTNHLKIXoPm7iBhUAjvRKNaUVBlr"
call String_Decoder
...
push offset "ugKLdNlLT6emldCeZi72mUjieuBqdfZ"
call String_Decoder
...
The obfuscated data is often decoded into a useful string on the stack, so the only way to see it is to view the stack once the string decoder is complete. Therefore, the best place to set a breakpoint to view all of the strings is at the end of the string decoder routine. In this way, each time you choose Play in OllyDbg, the program will continue executing and will break when a string is decoded for use. This method will identify only the strings the program uses as it uses them. Later in this chapter, we will discuss how to modify instructions to decode all of the strings at once.
As you learned in the previous chapter, conditional breakpoints are software breakpoints that will break only if a certain condition is true. OllyDbg allows you to set conditional breakpoints using expressions; each time the software breakpoint is hit, the expression is evaluated. If the expression result is nonzero, execution pauses.
Warning
Be careful when using conditional breakpoints. Setting one may cause your program to run much more slowly, and if you are incorrect about your condition, the program may never stop running.
Conditional software breakpoints can be particularly useful when you want to save time when trying to pause execution once a certain parameter is passed to a frequently called API function, as demonstrated in the following example.
You can use conditional breakpoints to detect memory allocations above a certain size. Consider Poison Ivy, a popular backdoor, which receives commands through the Internet from a command-and-control server operated by an attacker. The commands are implemented in shellcode, and Poison Ivy allocates memory to house the shellcode it receives. However, most of the memory allocations performed in Poison Ivy are small and uninteresting, except when the command-and-control server sends a large quantity of shellcode to be executed.
The best way to catch the Poison Ivy allocation for that shellcode is to set a conditional
breakpoint at the VirtualAlloc function in
Kernel32.dll. This is the API function that Poison Ivy uses to dynamically
allocate memory; therefore, if you set a conditional breakpoint when the allocation size is greater
than 100 bytes, the program will not pause when the smaller (and more frequent) memory allocations
occur.
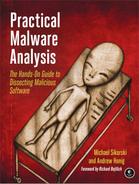
To set our trap, we can begin by putting a standard breakpoint at the start of the VirtualAlloc function to run until the breakpoint is hit. Figure 9-7 shows the stack window when a breakpoint is hit
at the start of VirtualAlloc.
The figure shows the top five items on the stack. The return address is first, followed by the
four parameters (Address, Size, AllocationType, and Protect) for VirtualAlloc. The parameters are labeled
next to their values and location in the stack. In this example, 0x29 bytes are to be allocated.
Since the top of the stack is pointed to by the ESP register in order to access the Size field, we must reference it in memory as [ESP+8].
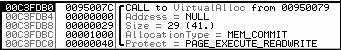
Figure 9-8 shows the disassembler window
when a breakpoint is hit at the start of VirtualAlloc. We set a
conditional breakpoint when [ESP+8]>100, in order to catch
Poison Ivy when it is about to receive a large amount of shellcode. To set this conditional software
breakpoint, follow these steps:
Right-click in the disassembler window on the first instruction of the function, and select Breakpoint ▶ Conditional. This brings up a dialog asking for the conditional expression.
Set the expression and click OK. In this example, use
[ESP+8]>100.Click Play and wait for the code to break.
OllyDbg provides functionality for setting hardware breakpoints through the use of dedicated hardware registers, as described in Chapter 8.
Hardware breakpoints are powerful because they don’t alter your code, stack, or any target resource. They also don’t slow down execution speed. As we noted in the previous chapter, the problem with hardware breakpoints is that you can set only four at a time.
To set hardware breakpoints on an instruction, right-click that instruction and select Breakpoint ▶ Hardware, on Execution.
You can tell OllyDbg to use hardware breakpoints instead of software breakpoints by default by using the Debugging Options menu. You might do this in order to protect against certain anti-debugging techniques, such as software breakpoint scanning, as we’ll discuss in Chapter 16.
OllyDbg supports memory breakpoints, allowing you to set a breakpoint on a chunk of memory in order to have the code break on access to that memory. OllyDbg supports the use of software and hardware memory breakpoints, as well as the ability to specify whether you want it to break on read, write, execute, or any access.
To set a basic memory breakpoint, select a portion of memory in the memory dump window or a section in the memory map, right-click it, and select Breakpoint ▶ Memory, on Access. You can set only one memory breakpoint at a time. The previously set memory breakpoint is removed if you set a new one.
OllyDbg implements software memory breakpoints by changing the attributes of memory blocks containing your selection. However, this technique is not always reliable and can bring with it considerable overhead. Therefore, you should use memory breakpoints sparingly.
Memory breakpoints are particularly useful during malware analysis when you want to find out when a loaded DLL is used: you can use a memory breakpoint to pause execution as soon as code in the DLL is executed. To do this, follow these steps:
Bring up the Memory Map window and right-click the DLL’s
.textsection (the section that contains the program’s executable code).Select Set Memory Breakpoint on Access.
Press F9 or click the play button to resume execution.
The program should break when execution ends up in the DLL’s .text section.