Carry out the following steps:
- We will first create a WMS for the PostGIS hotspot layer. Create a mapfile named hotspots.map in a directory accessible to the HTTPD (or IIS) user (for example, /var/www/data in Linux, /Library/WebServer/Documents/ for macOS, and C:\ms4w\Apache\htdocs in Windows), by executing the following code after adjusting the database connection settings:
        MAP # Start of mapfile
          NAME 'hotspots_time_series'
          IMAGETYPE         PNG
          EXTENT            -180 -90 180 90
          SIZE              800 400
          IMAGECOLOR        255 255 255

          # map projection definition
          PROJECTION
            'init=epsg:4326'
          END

          # a symbol for hotspots
          SYMBOL
            NAME "circle"
            TYPE ellipse
            FILLED true
            POINTS
              1 1
            END
          END

          # web section: here we define the ows services
          WEB
            # WMS and WFS server settings
            METADATA
              'wms_name'                'Hotspots'
              'wms_title'               'World hotspots time
                                         series'
              'wms_abstract'            'Active fire data detected
                                        by NASA Earth Observing
                                        System Data and Information
                                        System (EOSDIS)'
              'wms_onlineresource'      'http://localhost/cgi-bin/
                                        mapserv?map=/var/www/data/
                                        hotspots.map&'
              'wms_srs'                 'EPSG:4326 EPSG:3857'
              'wms_enable_request' '*'
              'wms_feature_info_mime_type'  'text/html'
            END
          END

          # Start of layers definition
          LAYER # Hotspots point layer begins here
            NAME            hotspots
            CONNECTIONTYPE  POSTGIS
            CONNECTION      'host=localhost dbname=postgis_cookbook
                             user=me
                             password=mypassword port=5432'
            DATA            'the_geom from chp09.hotspots'
            TEMPLATE 'template.html'
            METADATA
              'wms_title'                   'World hotspots time
                                             series'
              'gml_include_items' 'all'
            END
            STATUS          ON
            TYPE            POINT
            CLASS
              SYMBOL 'circle'
              SIZE 4
              COLOR        255 0 0
            END # end of class

          END # hotspots layer ends here

        END # End of mapfile
- Check whether the WMS GetCapabilities request for this mapfile is working well by typing the following URLs in the browser:
- http://localhost/cgi-bin/mapserv?map=/var/www/data/hotspots.map&SERVICE=WMS&VERSION=1.0.0&REQUEST=GetCapabilities (in Linux)
- http://localhost/cgi-bin/mapserv.exe?map=C:\ms4w\Apache\htdoc\shotspots.map&SERVICE=WMS&VERSION=1.0.0&REQUEST=GetCapabilities (in Windows)
- http://localhost/cgi-bin/mapserv?map=/Library/WebServer/Documents/hotspots.map& SERVICE=WMS&VERSION=1.0.0&REQUEST=GetCapabilities (in macOS)
In the following steps, we will be referring to Linux. If you are using Windows, you just need to replace http://localhost/cgi-bin/mapserv?map=/var/www/data/hotspots.map with http://localhost/cgi-bin/mapserv.exe?map=C:\ms4w\Apache\htdoc\shotspots.map; or if using macOS, replace it with http://localhost/cgi-bin/mapserv?map=/Library/WebServer/Documents/hotsposts.map in every request:
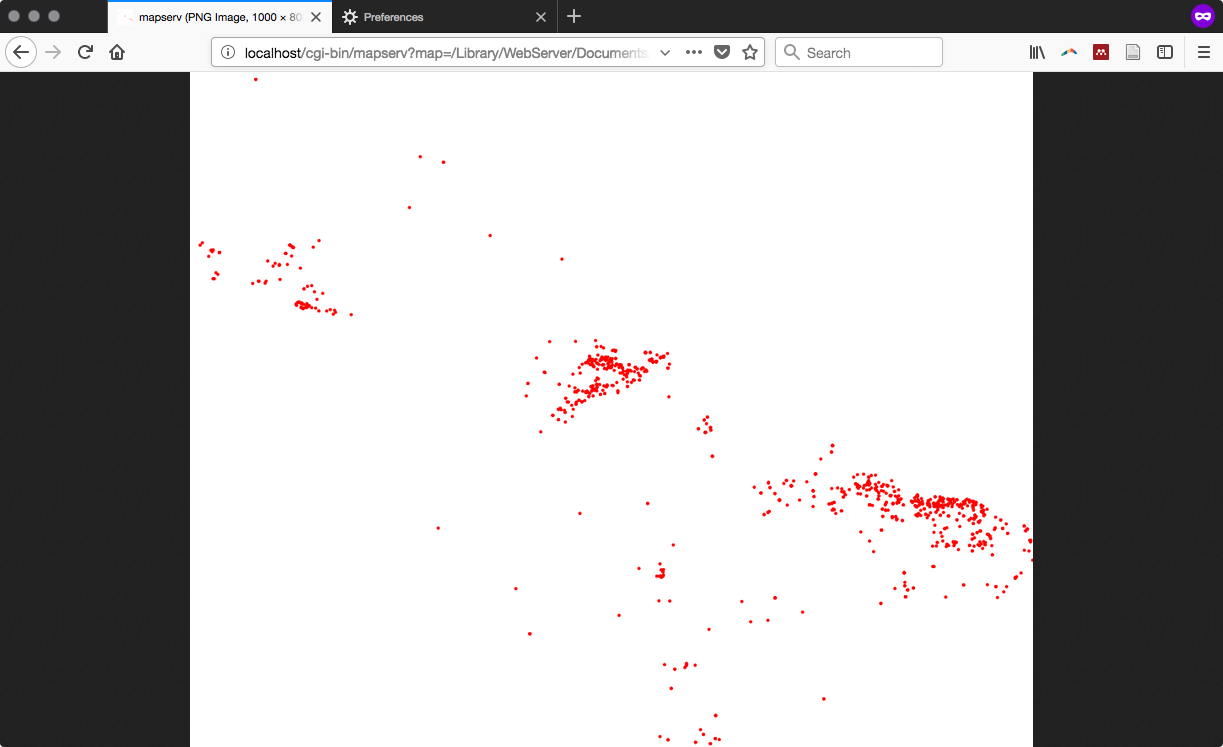
- Now query the WMS service with a GetMap request. Type the following URL in the browser. If everything is correct, MapServer should return an image with some hotspots as a response. The URL is http://localhost/cgi-bin/mapserv?map=/var/www/data/hotspots.map&&SERVICE=WMS&VERSION=1.3.0&REQUEST=GetMap&BBOX=-25,-100,35,-35&CRS=EPSG:4326&WIDTH=1000&HEIGHT=800&LAYERS=hotspots&STYLES=&FORMAT=image/png.
The map displayed on your browser will look as follows:
- Until now, you have implemented a simple WMS service. Now, to make the TIME parameter available for WMS Time requests, add the wms_timeextent, wms_timeitem and wms_timedefault variables in the LAYER METADATA section, as follows:
        METADATA
          'wms_title'                   'World hotspots time
                                         series'
          'gml_include_items' 'all'
          'wms_timeextent' '2000-01-01/2020-12-31' # time extent
            for which the service will give a response
          'wms_timeitem' 'acq_date' # layer field to use to filter
            on the TIME parameter
          'wms_timedefault' '2013-05-30' # default parameter if not
            added to the request
        END
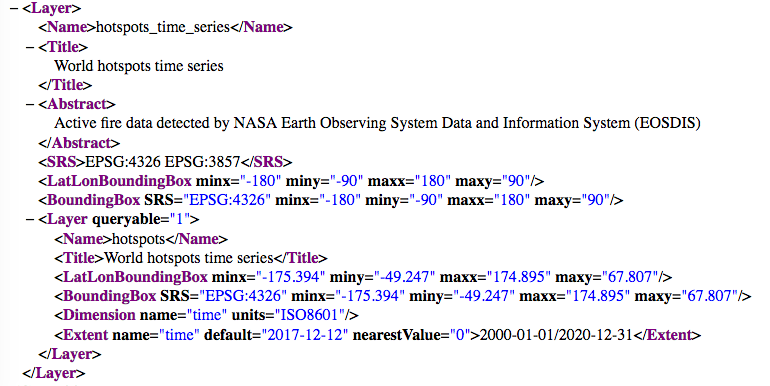
- Having added these parameters in the LAYER METADATA mapfile section, the WMS GetCapabilities response should change. Now, the hotspots layer definition includes the time dimension, defined by the <Dimension> and <Extent> elements. You will get a response, as follows:
- You can finally test the WMS service with time support. You only need to remember to add the TIME parameter in the GetMap request (otherwise, GetMap will filter out the data using the default date, which is 2017-12-12 in this example) using the URL http://localhost/cgi-bin/mapserv?map=/var/www/data/hotspots.map&&SERVICE=WMS&VERSION=1.3.0&REQUEST=GetMap&BBOX=-25,-100,35,-35&CRS=EPSG:4326&WIDTH=1000&HEIGHT=800&LAYERS=hotspots&STYLES=&FORMAT=image/png&TIME=2017-12-10.
- Play for a while with the TIME parameter in the preceding URL and try to see how the GetMap image response changes day by day. Remember that, for the dataset we imported, the acq_date range is from 2017-12-07 to 2017-12-14; but in your case, if you didn't use the hostpots shapefile included in the book dataset, the time range will be different!
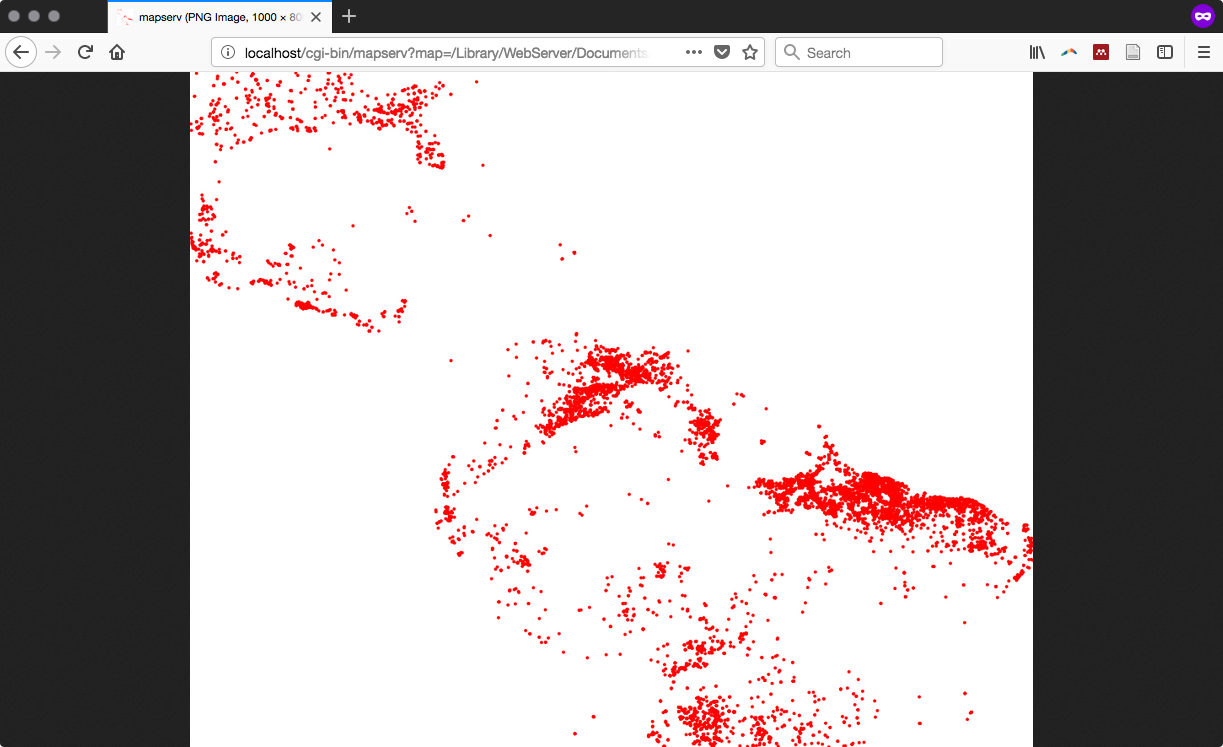
The following are different outputs for the mentioned dates and the full URLs used to query the service:- http://localhost/cgi-bin/mapserv?map=/var/www/data/hotspots.map&&SERVICE=WMS&VERSION=1.3.0&REQUEST=GetMap&BBOX=-25,-100,35,-35&CRS=EPSG:4326&WIDTH=1000&HEIGHT=800&LAYERS=hotspots&STYLES=&FORMAT=image/png&TIME=2017-12-14. The output is as follows (2017-12-14):
-
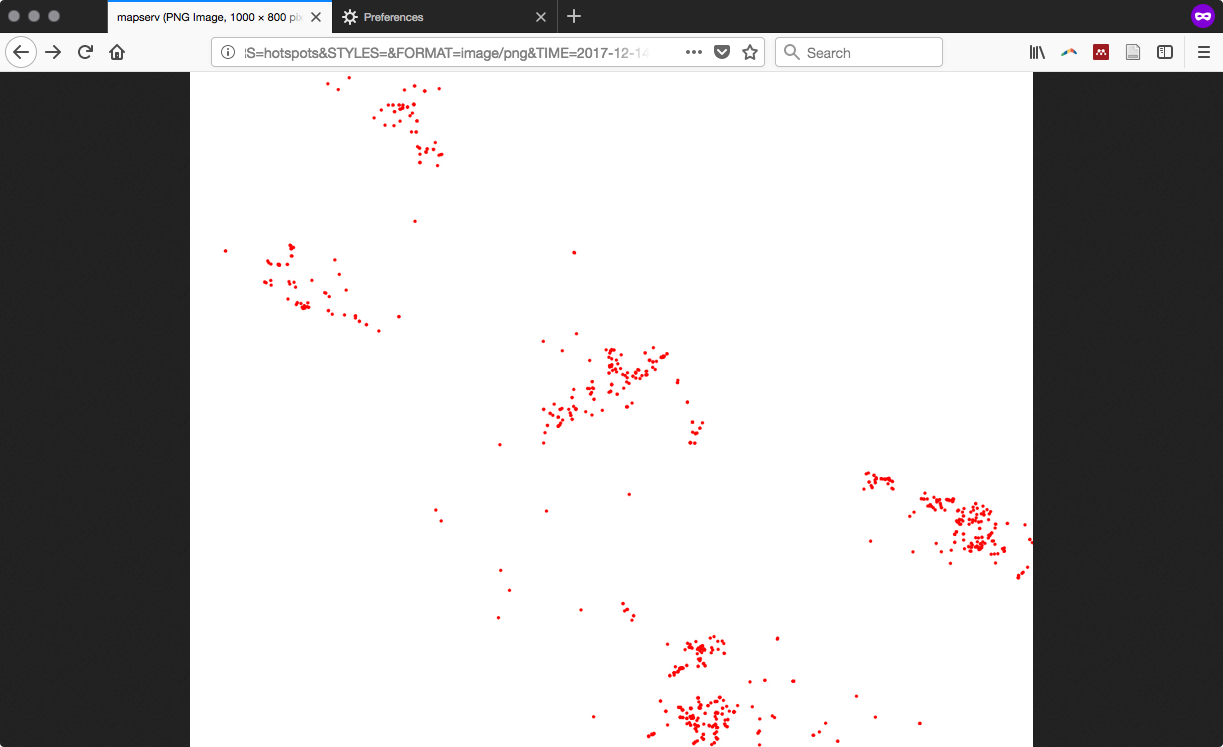
- http://localhost/cgi-bin/mapserv?map=/var/www/data/hotspots.map&&SERVICE=WMS&VERSION=1.3.0&REQUEST=GetMap&BBOX=-25,-100,35,-35&CRS=EPSG:4326&WIDTH=1000&HEIGHT=800&LAYERS=hotspots&STYLES=&FORMAT=image/png&TIME=2017-12-07. The output is as follows (2017-12-07):