Carry out the following steps:
- Open the GeoServer administrative interface, which is typically located at http://localhost:8080/geoserver, in your favorite browser and log in using your credentials (admin as the username and geoserver as the password) if you are just using the GeoServer default installation and have not customized things. After starting GeoServer, you should see the following:
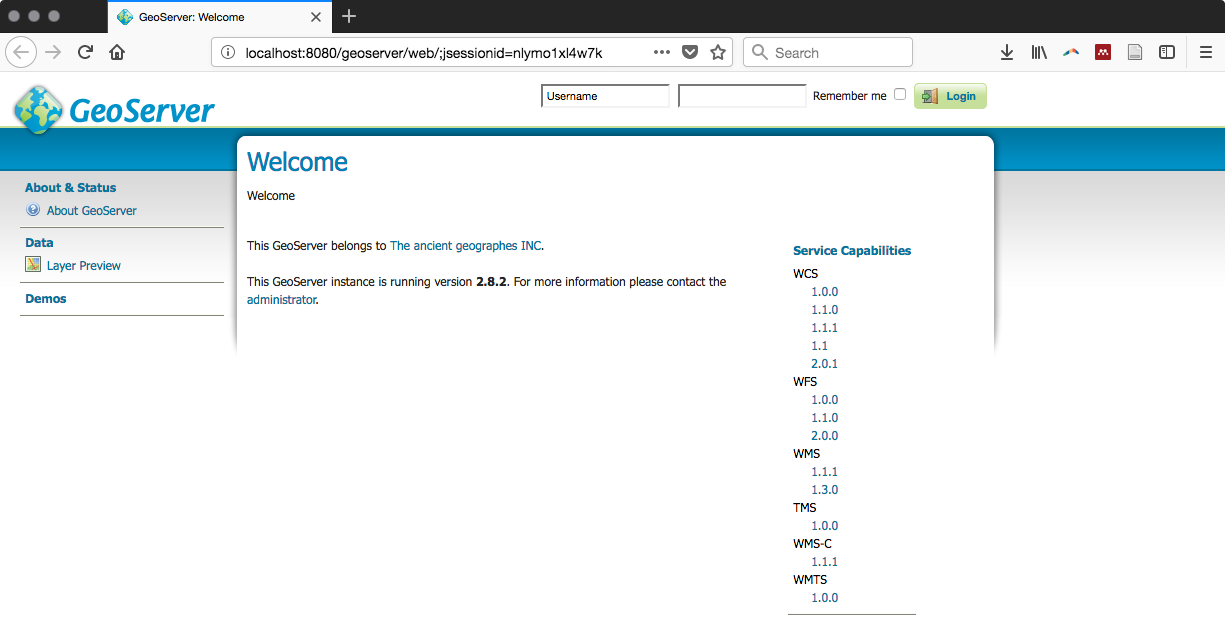
GeoServer welcome screen viewed in a browser
- After successfully logging in, create a workspace by clicking on the Workspace link under Work (in the left-hand-side panel of the GeoServer application's main menu) and then click on the Add new workspace link. In the text boxes of the form that appears, specify the following values and then click on the Submit button:
- Enter postgis_cookbook in the Name field
- Enter the URL https://www.packtpub.com/big-data-and-business-intelligence/postgis-cookbook in the Namespace URI field
- Now, to create a PostGIS store, click on the Stores link under Data (in the left-hand-side panel of the GeoServer application's main menu). Now, click on the Add new store link, and then on the PostGIS link under Vector Data Sources, as shown in the following screenshot:
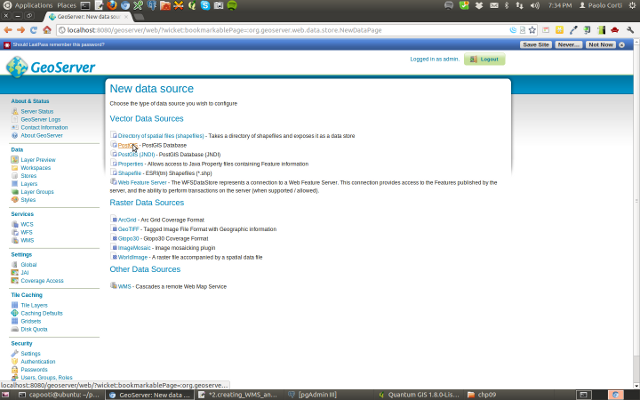
GeoServer screen to configure new data sources
- In the New Vector Data Source page, complete the form's fields, as follows:
- Select postgis_cookbook from the Workspace drop-down list.
- Enter postgis_cookbook in the Data Source Name field.
- Enter localhost in the host field.
- Enter 5432 in the port field.
- Enter postgis_cookbook in the database field.
- Enter chp09 in the schema field.
- Enter me in the user field.
- Enter mypassword in the passwd field.
The New Vector Data Source page is shown in the following screenshot:
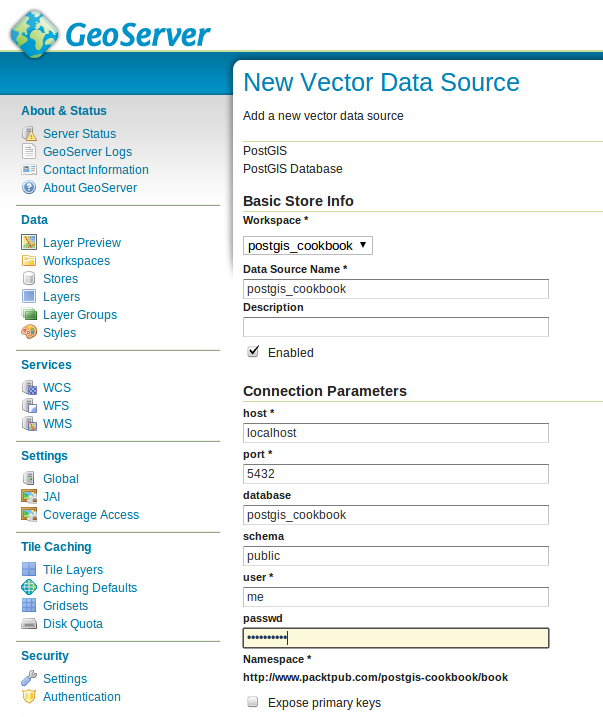
- Now, click on the Save button to successfully create your PostGIS store.
- Now, you are ready to publish the PostGIS counties layer as WMS and WFS. On the Layers page, click on the Add a new resource link. Now, select postgis_cookbook from the Add layer from drop-down list. Click on the Publish link to the right of the counties layer.
- On the Edit Layer page, shown in the following screenshot, click on the links Compute from data and Compute from native bounds, and then click on the Save button:
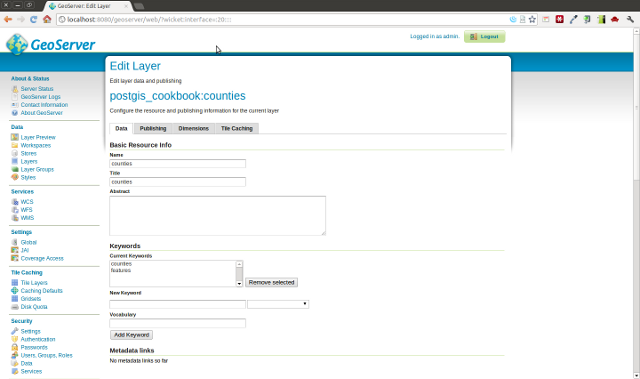
GeoServer screen to edit the countries layer for publishing
- Now, you need to define the style used to display the layer to the user. Unlike MapServer, GeoServer uses the OGC-standard Styled Layer Descriptor (SLD) notation. Click on the Styles link under Data and then on the Add new style link. Fill the text fields in the form, as follows:
- Enter Counties classified per size in the Name field.
- Enter postgis_cookbook in the Workspace field
- In the text area for the SLD, add the following XML code defining the style for the counties layer. Then, click on the Validate button to check whether your SLD definition is correct and then click on the Submit button to save the new style:
        <?xml version="1.0" encoding="UTF-8"?>
        <sld:StyledLayerDescriptor xmlns="http://www.opengis.net/sld"
         xmlns:sld="http://www.opengis.net/sld"
         xmlns:ogc="http://www.opengis.net/ogc"
         xmlns:gml="http://www.opengis.net/gml" version="1.0.0">
          <sld:NamedLayer>
            <sld:Name>county_classification</sld:Name>
            <sld:UserStyle>
              <sld:Name>county_classification</sld:Name>
              <sld:Title>County area classification</sld:Title>
              <sld:FeatureTypeStyle>
                <sld:Name>name</sld:Name>
                <sld:Rule>
                  <sld:Title>Large counties</sld:Title>
                  <ogc:Filter>
                    <ogc:PropertyIsGreaterThanOrEqualTo>
                      <ogc:PropertyName>square_mil</ogc:PropertyName>
                      <ogc:Literal>5000</ogc:Literal>
                    </ogc:PropertyIsGreaterThanOrEqualTo>
                  </ogc:Filter>
                  <sld:PolygonSymbolizer>
                    <sld:Fill>
                      <sld:CssParameter
                       name="fill">#FF0000</sld:CssParameter>
                    </sld:Fill>
                    <sld:Stroke/>
                  </sld:PolygonSymbolizer>
                </sld:Rule>
                <sld:Rule>
                  <sld:Title>Small counties</sld:Title>
                  <ogc:Filter>
                    <ogc:PropertyIsLessThan>
                       <ogc:PropertyName>square_mil</ogc:PropertyName>
                      <ogc:Literal>5000</ogc:Literal>
                    </ogc:PropertyIsLessThan>
                  </ogc:Filter>
                  <sld:PolygonSymbolizer>
                    <sld:Fill>
                      <sld:CssParameter
                       name="fill">#0000FF</sld:CssParameter>
                    </sld:Fill>
                    <sld:Stroke/>
                  </sld:PolygonSymbolizer>
                </sld:Rule>
              </sld:FeatureTypeStyle>
            </sld:UserStyle>
          </sld:NamedLayer>
        </sld:StyledLayerDescriptor>
The following screenshot shows how the new style looks on the New style GeoServer page:
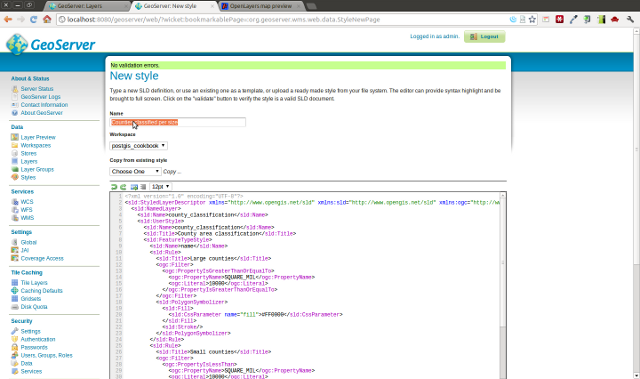
GeoServer screen for creating a new style as an SLD document
- Now you need to associate the created style with the counties layer. Go back to the layer page (Data | Layers), click on the counties layer link, and then, on the Edit Layer page, click on the Publishing section. Select Counties classified per size in the Default style drop-down list and then click on the Save button.
- Now that your WMS and WFS services for the PostGIS counties layer are ready, it is time to start using them! First, test the GetCapabilities WMS request. To do this, you can click on one of the links on the right-hand-side panel on the GeoServer web application home page. You can click on the link for either WMS version 1.1.1 or WMS version 1.3.0. Click on one of the links or type the GetCapabilities request directly in the browser as http://localhost:8080/geoserver/ows?service=wms&version=1.3.0&request=GetCapabilities.
- Now, we will investigate the GetCapabilities response, shown as follows. You will find a lot of information about WMS is available on your GeoServer instance, such as the WMS-supported requests, projections, and a lot of other information about each published layer. In the case of the counties layer, the following code is an extract from the GetCapabilities document. Note the main layer information, such as the name, title, abstract (you could redefine all of these using the GeoServer web application), the supported Coordinate Reference Systems (CRS), the geographic extent, and the associated style:
<Layer queryable="1">
<Name>postgis_cookbook:counties</Name>
<Title>counties</Title>
<Abstract/>
<KeywordList>
<Keyword>counties</Keyword>
<Keyword>features</Keyword>
</KeywordList>
<CRS>EPSG:4326</CRS>
<CRS>CRS:84</CRS>
<EX_GeographicBoundingBox>
<westBoundLongitude>-179.133392333984
</westBoundLongitude>
<eastBoundLongitude>-64.566162109375
</eastBoundLongitude>
<southBoundLatitude>17.6746921539307
</southBoundLatitude>
<northBoundLatitude>71.3980484008789
</northBoundLatitude>
</EX_GeographicBoundingBox>
<BoundingBox CRS="CRS:84" minx="-179.133392333984"
miny="17.6746921539307" maxx="-64.566162109375"
maxy="71.3980484008789"/>
<BoundingBox CRS="EPSG:4326" minx="17.6746921539307"
miny="-179.133392333984" maxx="71.3980484008789" maxy="-
64.566162109375"/>
<Style>
<Name>Counties classified per size</Name>
<Title>County area classification</Title>
<Abstract/>
<LegendURL width="20" height="20">
<Format>image/png</Format>
<OnlineResource
xmlns:xlink="http://www.w3.org/1999/xlink"
xlink:type="simple" xlink:href=
"http://localhost:8080/geoserver/
ows?service=WMS&request=GetLegendGraphic&
format=image%2Fpng&width=20&height=20&
layer=counties"/>
</LegendURL>
</Style>
</Layer>
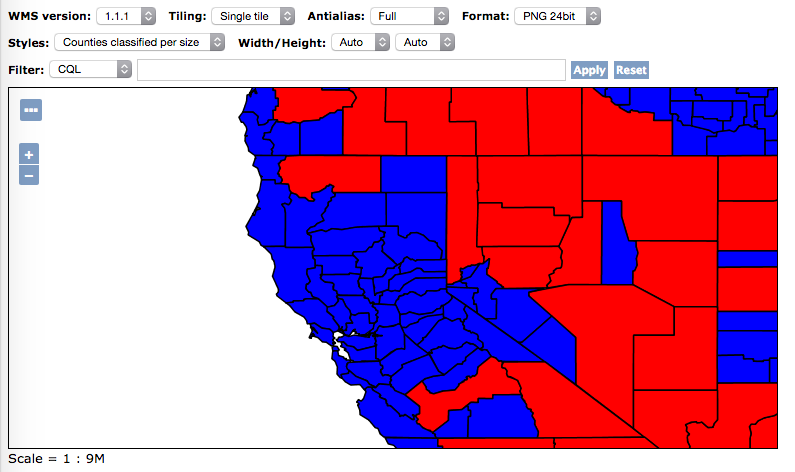
- To test the GetMap and GetFeatureInfo WMS requests, the GeoServer web application offers you a very handy way with the Layer Preview page. Navigate to Data | Layer Preview and then click on the OpenLayers link next to the counties layer. The Layer Preview page is based on the OpenLayers JavaScript library and lets you experiment with the GetMap and GetFeatureInfo requests.
- Try to navigate the map; at each zoom and pan action, GeoServer will stream out a new image provided by the response output to a GetMap request. By clicking on the map, you can perform a GetFeatureInfo request and the user interface will display the feature's attributes corresponding to the point on the map on which you clicked. A very effective way to check how the requests are sent to GeoServer as you navigate the map is by using the Firefox Firebug plugin or the Chrome (or Chromium if you are using Linux) Developer Tools. With these tools, you will be able to identify the GetMap and GetFeatureInfo requests that are being sent behind the scenes from the OpenLayers viewer to GeoServer. One such map is shown in the following screenshot:
Here is what you get when inspecting the requests with any in-browser developer tool, check the request URL, and verify the parameters sent to geoserver; this is how it looks with Firefox:
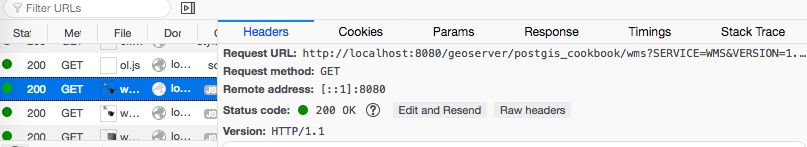
- Now, try a WMS GetMap request by typing the URL http://localhost:8080/geoserver/postgis_cookbook/wms?LAYERS=postgis_cookbook%3Acounties&STYLES=&FORMAT=image%2Fpng&SERVICE=WMS&VERSION=1.1.1&REQUEST=GetMap&SRS=EPSG%3A4326&BBOX=-200.50286594033,7.6152902245522,-43.196688503029,81.457450330258&WIDTH=703&HEIGHT=330 in your browser.
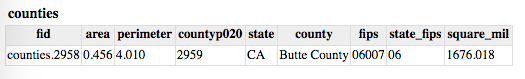
- Try a WMS GetFeatureInfo request, as well, by typing the URL http://localhost:8080/geoserver/postgis_cookbook/wms?REQUEST=GetFeatureInfo&EXCEPTIONS=application%2Fvnd.ogc.se_xml&BBOX=-126.094303%2C37.16812%2C-116.262667%2C41.783255&SERVICE=WMS&INFO_FORMAT=text%2Fhtml&QUERY_LAYERS=postgis_cookbook%3Acounties&FEATURE_COUNT=50&Layers=postgis_cookbook%3Acounties&WIDTH=703&HEIGHT=330&format=image%2Fpng&styles=&srs=EPSG%3A4326&version=1.1.1&x=330&y=158.
This will be displayed by prompting the previous URL:
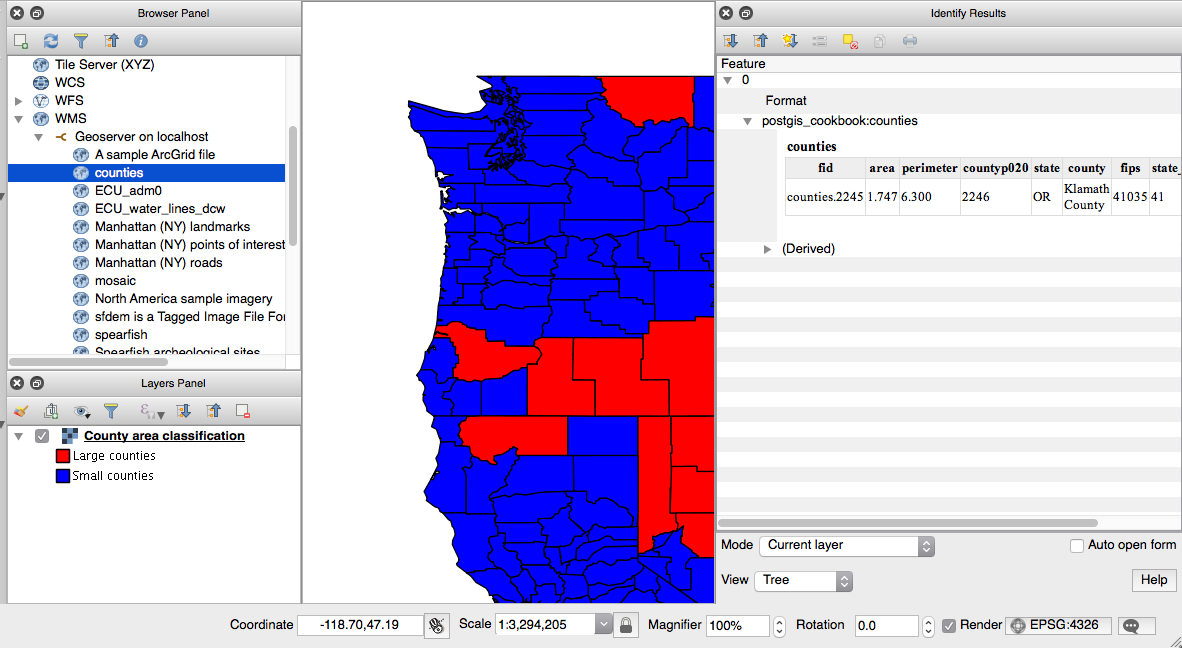
- Now, as you did for the MapService WMS, test the GeoServer WMS in QGIS. Create a WMS connection named GeoServer on localhost, pointing to the GeoServer GetCapabilities document (http://localhost:8080/geoserver/ows?service=wms&version=1.3.0&request=GetCapabilities). Then, connect to the WMS server (for example, from the QGIS browser), select counties from the Layers list, and add it to the map, as shown in the following screenshot; then navigate the layer and try to identify some of the features:
- Having used WMS, try to test a couple of WFS requests. A typical WFS GetCapability request can be executed by typing the URL http://localhost:8080/geoserver/wfs?service=wfs&version=1.1.0&request=GetCapabilities. You could also click on one of the WFS links on the home page of the GeoServer web interface.
- Investigate the XML GetCapabilities response and try to identify the information about your layer. You should have a <FeatureType> element, such as the following, corresponding to the counties layer:
        <FeatureType>
          <Name>postgis_cookbook:counties</Name>
          <Title>counties</Title>
          <Abstract/>
          <Keywords>counties, features</Keywords>
          <SRS>EPSG:4326</SRS>
          <LatLongBoundingBox minx="-179.133392333984"
           miny="17.6746921539307" maxx="-64.566162109375"
           maxy="71.3980484008789"/>
        </FeatureType>
- As shown in the previous recipe, a typical WFS request is GetFeature, which will result in a GML response. Try it by typing the URL http://localhost:8080/geoserver/wfs?service=wfs&version=1.0.0&request=GetFeature&typeName=postgis_cookbook:counties&maxFeatures=5 in your browser. You will receive a GML output composed of a <wfs:FeatureCollection> element and a collection of <gml:featureMember> elements (possibly five elements, as specified in the maxFeatures request's parameter). You will get an output that is similar to the following code:
        <gml:featureMember>
          <postgis_cookbook:counties fid="counties.3962">
            <postgis_cookbook:the_geom>
              <gml:Polygon srsName="http://www.opengis.net/
               gml/srs/epsg.xml#4326">
                <gml:outerBoundaryIs>
                  <gml:LinearRing>
                    <gml:coordinates xmlns:gml=
                     "http://www.opengis.net/gml"
                     decimal="." cs="," ts="">
                     -101.62554932,36.50246048 -
                     101.0908432,36.50032043 ...
                     ...
                     ...
                    </gml:coordinates>
                  </gml:LinearRing>
                </gml:outerBoundaryIs>
              </gml:Polygon>
            </postgis_cookbook:the_geom>
             <postgis_cookbook:area>0.240</postgis_cookbook:area>
            <postgis_cookbook:perimeter>1.967
            </postgis_cookbook:perimeter>
            <postgis_cookbook:co2000p020>3963.0
            </postgis_cookbook:co2000p020>
             <postgis_cookbook:state>TX</postgis_cookbook:state>
            <postgis_cookbook:county>Hansford
             County</postgis_cookbook:county>
             <postgis_cookbook:fips>48195</postgis_cookbook:fips>
            <postgis_cookbook:state_fips>48
            </postgis_cookbook:state_fips>
            <postgis_cookbook:square_mil>919.801
            </postgis_cookbook:square_mil>
          </postgis_cookbook:counties>
        </gml:featureMember>
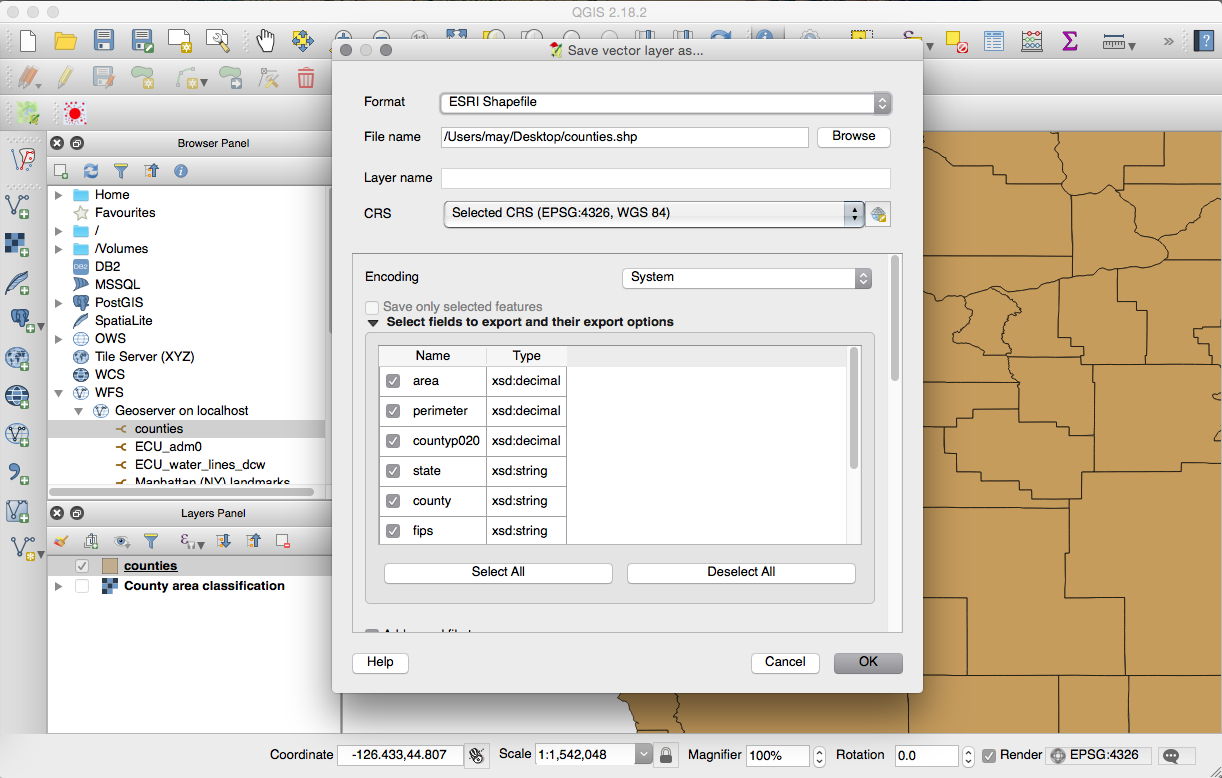
- Now, as you did with WMS, try the counties WFS in QGIS (or in your favorite desktop GIS client). Create a new WFS connection by using either the QGIS browser or the Add WFS Layer button and then clicking on the New Connection button. In the Create a new WFS connection dialog box, type GeoServer on localhost in the Name field and add the WFS GetCapabilities URL (http://localhost:8080/geoserver/wfs?service=wfs&version=1.1.0&request=GetCapabilities) in the URL field.
- Add the WFS counties layer from the previous dialog box and, as a test, select some of the counties and export them to a new shapefile using the Save As command from the layer's context menu, as shown in the following screenshot: