The steps you need to follow to complete this recipe are as follows:
- In case you still haven't done it, export the countries shapefile to PostGIS using the ogr2ogr or the shp2pgsql commands. The shp2pgsql approach is as shown:
      $ shp2pgsql -I -d -s 4326 -W LATIN1 -g the_geom countries.shp
      chp01.countries > countries.sql
      $ psql -U me -d postgis_cookbook -f countries.sql
- The ogr2ogr approach is as follows:
      $ ogr2ogr -f PostgreSQL PG:"dbname='postgis_cookbook' user='me'
      password='mypassword'"
      -lco SCHEMA=chp01 countries.shp -nlt MULTIPOLYGON -lco OVERWRITE=YES
      -lco GEOMETRY_NAME=the_geom
- Now, query PostGIS in order to get a list of countries grouped by the subregion field. For this purpose, you will merge the geometries for features having the same subregion code, using the ST_Union PostGIS geometric processing function:
      postgis_cookbook=> SELECT subregion,
        ST_Union(the_geom) AS the_geom, SUM(pop2005) AS pop2005
        FROM chp01.countries GROUP BY subregion;
- Execute the pgsql2shp PostGIS command to export into a shapefile the result of the given query:
      $ pgsql2shp -f subregions.shp -h localhost -u me -P mypassword
      postgis_cookbook "SELECT MIN(subregion) AS subregion,
      ST_Union(the_geom) AS the_geom, SUM(pop2005) AS pop2005
      FROM chp01.countries GROUP BY subregion;"

      Initializing...
      Done (postgis major version: 2).
      Output shape: Polygon
      Dumping: X [23 rows].
- Open the shapefile and inspect it with your favorite desktop GIS. This is how it looks in QGIS after applying a graduated classification symbology style based on the aggregated population for each subregion:
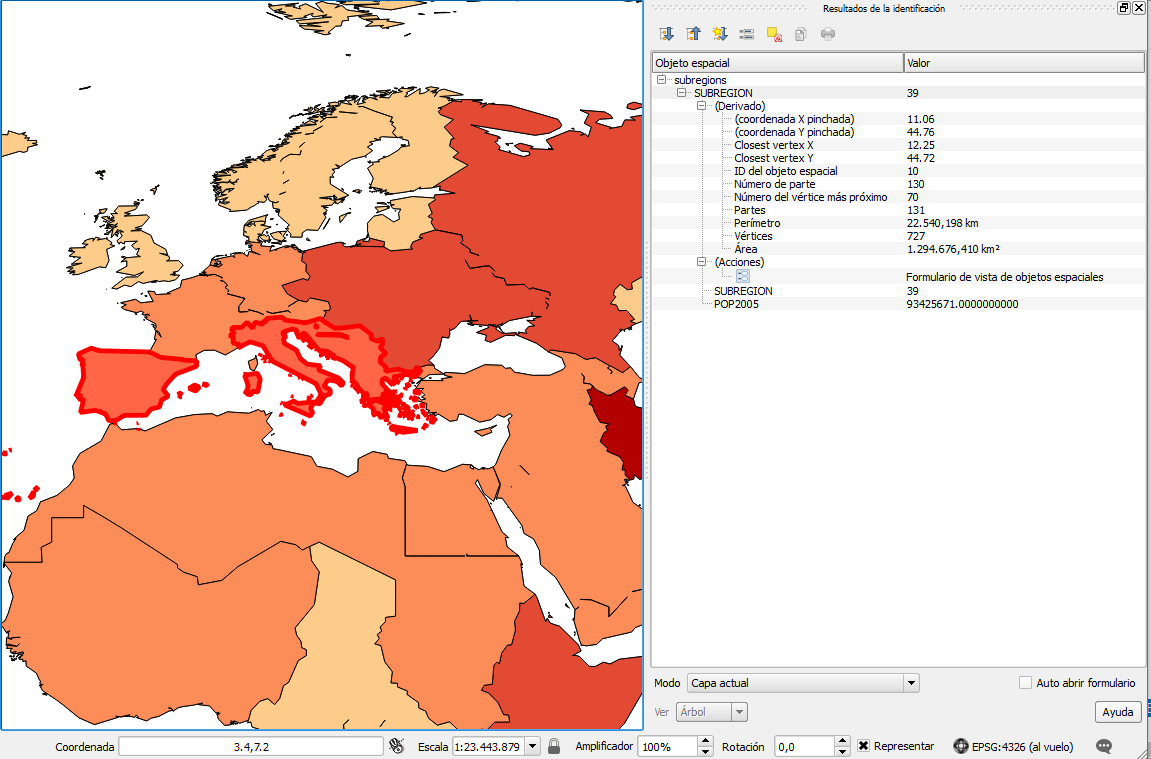
Visualization in QGIS of the classification of subregions based on population and information of the selected feature