We will then populate the centroid table by generating the cluster ID for each geometry in chp03.earthquakes using the ST_ClusterKMeans function, and then we will use the ST_Centroid function to calculate the 10 centroids for each cluster:
INSERT INTO chp04.earthq_cent (the_geom, cid) (
  SELECT DISTINCT ST_SetSRID(ST_Centroid(tab2.ge2), 4326) as centroid,
  tab2.cid FROM(
    SELECT ST_UNION(tab.ge) OVER (partition by tab.cid ORDER BY tab.cid)
    as ge2, tab.cid as cid FROM(
      SELECT ST_ClusterKMeans(e.the_geom, 10) OVER() AS cid, e.the_geom
      as ge FROM chp03.earthquakes as e) as tab
  )as tab2
);
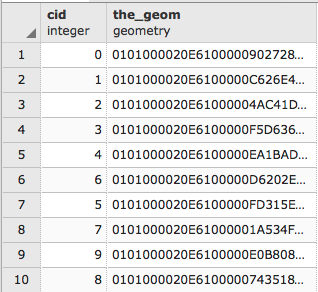
If we check the inserted rows with the following command:
SELECT * FROM chp04.earthq_cent;
The output will be as follows:
Then, insert the corresponding minimum bounding circles for the clusters in the chp04.earthq_circ table. Execute the following SQL command:
# INSERT INTO chp04.earthq_circ (the_geom, cid) (
  SELECT DISTINCT ST_SetSRID(
    ST_MinimumBoundingCircle(tab2.ge2), 4326) as circle, tab2.cid
    FROM(
      SELECT ST_UNION(tab.ge) OVER (partition by tab.cid ORDER BY tab.cid)
      as ge2, tab.cid as cid
      FROM(
        SELECT ST_ClusterKMeans(e.the_geom, 10) OVER() as cid, e.the_geom
        as ge FROM chp03.earthquakes AS e
      ) as tab
    )as tab2
  );
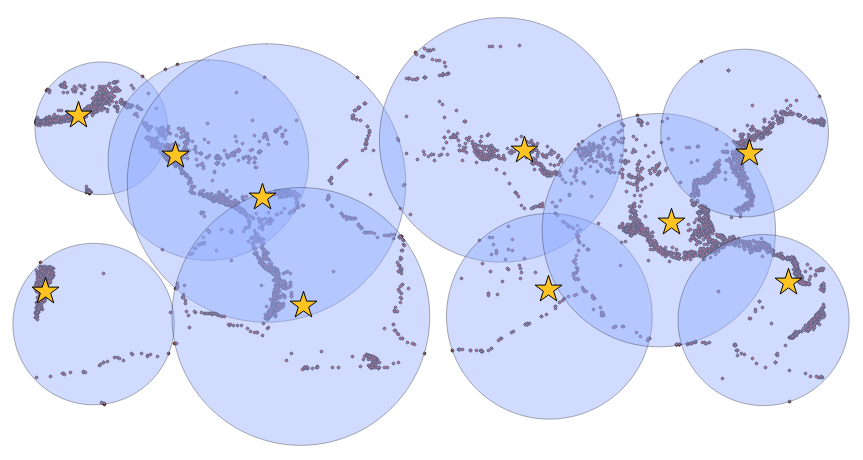
In a desktop GIS, import all three tables as layers (chp03.earthquakes, chp04.earthq_cent, and chp04.earthq_circ) in order to visualize them and understand the clustering. Note that circles may overlap; however, this does not mean that clusters do as well, since each point belongs to one and only one cluster, but the minimum bounding circle for a cluster may overlap with another minimum bounding circle for another cluster: