Carry out the following steps:
- Create a new HTML file and name it leaflet.html (available in the book source code package). Open it and add the <head> and <body> tags. In the <head> section, import the Leaflet CSS and JavaScript libraries and the jQuery JavaScript library (you will use jQuery to send an AJAX request to the GetFeatureInfo from the MapServer WMS):
        <html>
          <head>
            <title>Leaflet Example</title>
            <link rel="stylesheet"
             href= "https://unpkg.com/leaflet@1.2.0/dist/leaflet.css" />
            <script src= "https://unpkg.com/leaflet@1.2.0/dist/leaflet.js">
            </script>
            <script src="http://ajax.googleapis.com/ajax/
                    libs/jquery/1.9.1/jquery.min.js">
            </script>
          </head>
          <body>
          </body>
        </html>
- Start adding a <div> tag in the <body> element to include the Leaflet map in your file, as shown in the following code; the map will have a width of 800 pixels and a height of 500 pixels:
<div id="map" style="width:800px; height:500px"></div>
- Just after the <div> element containing the map, add the following JavaScript code. Create a Leaflet tileLayer object using the tile.osm.org service based on OpenStreetMap data:
        <script defer="defer" type="text/javascript">
          // osm layer
          var osm = L.tileLayer('http://{s}.tile.osm.org
                    /{z}/{x}/{y}.png', {
            maxZoom: 18,
            attribution: "Data by OpenStreetMap"
          });
        </script>
- Create a second layer that will use the MapServer WMS you created a few recipes ago in this chapter. You will need to set the ms_url variable differently if you're using Linux, Windows, or macOS:
-
- For Linux, use the following code:
                // mapserver layer
                var ms_url = "http://localhost/cgi-bin/mapserv?
                  map=/var/www/data/countries.map&";
                var countries = L.tileLayer.wms(ms_url, {
                  layers: 'countries',
                  format: 'image/png',
                  transparent: true,
                  opacity: 0.7
                });
-
- For Windows, use the following code:
                // mapserver layer
                var ms_url = "http://localhost
                  /cgi-bin/mapserv.exe?map=C:%5Cms4w%5CApache%5
                  Chtdocs%5Ccountries.map&";
                var countries = L.tileLayer.wms(ms_url, {
                  layers: 'countries',
                  format: 'image/png',
                  transparent: true,
                  opacity: 0.7
                });
-
- For macOS, use the following code:
                // mapserver layer
                var ms_url = "http://localhost/cgi-bin/mapserv?
                  map=/Library/WebServer/Documents/countries.map&";
                var countries = L.tileLayer.wms(ms_url, {
                  layers: 'countries',
                  format: 'image/png',
                  transparent: true,
                  opacity: 0.7
                });
- Create the Leaflet map and add layers to it, as shown in the following code:
        // map creation
        var map = new L.Map('map', {
          center: new L.LatLng(15, 0),
          zoom: 2,
          layers: [osm, countries],
          zoomControl: true
        });
- Now, associate the mouse-click event with a function that will perform the GetFeatureInfo WMS request on the countries layer, by executing the following code:
        // getfeatureinfo event
        map.addEventListener('click', Identify);

        function Identify(e) {
          // set parameters needed for GetFeatureInfo WMS request
          var BBOX = map.getBounds().toBBoxString();
          var WIDTH = map.getSize().x;
          var HEIGHT = map.getSize().y;
          var X = map.layerPointToContainerPoint(e.layerPoint).x;
          var Y = map.layerPointToContainerPoint(e.layerPoint).y;
          // compose the URL for the request
          var URL = ms_url + 'SERVICE=WMS&VERSION=1.1.1&
          REQUEST=GetFeatureInfo&LAYERS=countries&
           QUERY_LAYERS=countries&BBOX='+BBOX+'&FEATURE_COUNT=1&
          HEIGHT='+HEIGHT+'&WIDTH='+WIDTH+'&
           INFO_FORMAT=text%2Fhtml&SRS=EPSG%3A4326&X='+X+'&Y='+Y;
          //send the asynchronous HTTP request using
          jQuery $.ajax
          $.ajax({
            url: URL,
            dataType: "html",
            type: "GET",
            success: function(data) {
              var popup = new L.Popup({
                maxWidth: 300
              });
              popup.setContent(data);
              popup.setLatLng(e.latlng);
              map.openPopup(popup);
            }
          });
        }
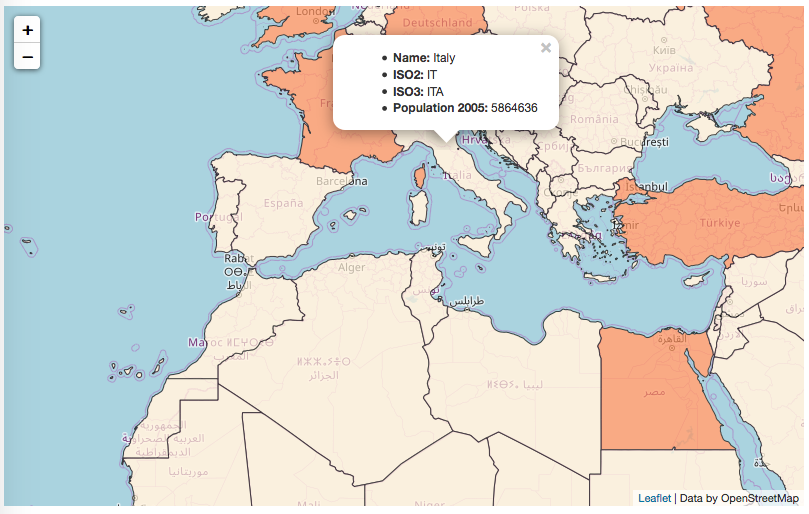
- Your HTML file should now look like the leaflet.html file contained in data/chp09. You can now deploy this file to your web server (that is, Apache HTTPD or IIS). If you are using Apache HTTPD in Linux, you could copy the file to the /var/www/data directory; if you are running macOS, copy it to /Library/WebServer/Documents/data ;and if you are using Windows, you could copy it to C:\ms4w\Apache\htdocs\data (create the data directory if it does not already exist). Then, access it with the URL http://localhost/data/leaflet.html.
- Open the web page using your favorite browser, and start navigating the map; zoom, pan, and try to click on a point to identify one feature from the countries PostGIS layer, as shown in the following screenshot: