Table of Contents for
Learning D3.js 4 Mapping - Second Edition

Version ebook / Retour

Cover image for bash Cookbook, 2nd Edition Learning D3.js 4 Mapping - Second Edition by Lars Verspohl Published by Packt Publishing, 2017
  1. Learning D3.js 4 Mapping, Second Edition
  2. Title Page
  3. Second Edition
  4. Copyright
  5. Learning D3.js 4 Mapping
  6. Second Edition
  7. Credits
  8. About the Authors
  9. About the Reviewers
  10. www.PacktPub.com
  11. Why subscribe?
  12. Customer Feedback
  13. Table of Contents
  14. Preface
  15. What this book covers
  16. What you need for this book
  17. Who this book is for
  18. Conventions
  19. Reader feedback
  20. Customer support
  21. Downloading the example code
  22. Downloading the color images of this book 
  23. Errata
  24. Piracy
  25. Questions
  26. Gathering Your Cartography Toolbox
  27. Quick bootstrap
  28. Step-by-step bootstrap
  29. A lightweight web server
  30. Using the web browser as a development tool
  31. Installing the sample code
  32. Working with the developer tools
  33. Summary
  34. Creating Images from Simple Text
  35. The SVG coordinate system
  36. Line
  37. Rectangle
  38. Circle
  39. Polygon
  40. Path
  41. Experiment
  42. Paths with curves
  43. Transform
  44. Translate
  45. Scale
  46. Grouping
  47. Text
  48. Summary
  49. Producing Graphics from Data - the Foundations of D3
  50. Creating basic SVG elements
  51. The enter() function
  52. The update function
  53. The exit() function
  54. AJAX
  55. Summary
  56. Creating a Map
  57. Foundation - creating your basic map
  58. Including the dataset
  59. Experiment 1 – adjusting the bounding box
  60. Experiment 2 – creating choropleths
  61. Experiment 3 – adding click events to our visualization
  62. Experiment 4 – using updates and transitions to enhance our visualization
  63. Experiment 5 – adding points of interest
  64. Experiment 6 – adding visualizations as a point of interest
  65. Summary
  66. Click-Click Boom! Applying Interactivity to Your Map
  67. Events and how they occur
  68. Experiment 1 – hover events and tooltips
  69. Experiment 2 – tooltips with visualizations
  70. Experiment 3 – panning and zooming
  71. Experiment 4 – orthographic projections
  72. Experiment 5 – rotating orthographic projections
  73. Experiment 6 – dragging orthographic projections
  74. Summary
  75. Finding and Working with Geographic Data
  76. Geodata file types
  77. What are shapefiles and how do I get them?
  78. Acquiring shapefiles for a specific country
  79. GeoJSON
  80. A quick map in D3 with only GeoJSON
  81. TopoJSON basics
  82. TopoJSON command-line tips
  83. Preserving specific attributes
  84. Simplification
  85. Merging files
  86. Summary
  87. Testing
  88. Code organization and reusable assets
  89. Project structure
  90. Exploring the code directory
  91. Other administrative files
  92. Writing testable code
  93. Keeping methods/functions small
  94. Preventing side effects
  95. An example with viz.js
  96. Unit testing
  97. Creating resilient visualization code
  98. Adding a new test case
  99. Summary
  100. Drawing with Canvas and D3
  101. Introducing Canvas
  102. Drawing with Canvas
  103. The three drawing steps of every Canvas visual
  104. Drawing various shapes with Canvas
  105. Animating the Canvas
  106. Animating the Canvas way
  107. Getting a general overview
  108. Preparing the rain data
  109. Updating each drop
  110. Drawing frame by frame
  111. Canvas and D3
  112. Getting an overview of our experiment
  113. The data
  114. Updating each drop
  115. Binding the data
  116. Drawing the data
  117. Running the app
  118. Summary
  119. Mapping with Canvas and D3
  120. Choosing Canvas or SVG
  121. Reasons to choose SVG
  122. Reasons to choose Canvas
  123. Visualizing flight paths with Canvas and D3
  124. The data
  125. Building the flight path map in SVG
  126. Measuring the performance
  127. Building the flight path map in Canvas
  128. Setting up the map
  129. Drawing the map and listening for user input
  130. Preparing and drawing with Canvas
  131. Drawing the background scene
  132. Defining the planes
  133. Calculating the plane's positions
  134. Animating the plane
  135. Measuring the performance
  136. Optimizing performance
  137. Continuing with measuring performance
  138. Summary
  139. Adding Interactivity to Your Canvas Map
  140. Why Canvas interaction is different
  141. Drawing the world on a Canvas
  142. Setting up
  143. Drawing the world
  144. Making the world move
  145. Setting up the behavior
  146. Handling zoom and rotation
  147. Finding the Canvas object under the mouse - Picking
  148. Picking, the theory
  149. Creating all things hidden
  150. Drawing the hidden Canvas
  151. Picking the values
  152. Storing more data and using a lookup array
  153. Highlighting the country on mouse over
  154. Visualizing data per country and adding a tooltip
  155. Adding new data to our old globe
  156. Coloring the globe
  157. Adding a tooltip
  158. The HTML
  159. Building the static parts of the tooltip
  160. Showing and hiding the tooltip
  161. Summary
  162. Shaping Maps with Data - Hexbin Maps
  163. Reviewing map visualization techniques
  164. Choropleth maps
  165. Cartograms
  166. Dot density maps
  167. Value and use of the hexagon
  168. Making a hexbin map
  169. Reviewing the hexbin algorithm
  170. Setting it up
  171. Drawing the map
  172. Drawing a point grid for our hexagons
  173. Keeping only the points within the map
  174. Making the hex tile
  175. Retrieving the hexagon center points
  176. Drawing the hex tiles
  177. Joining data points to the layout points
  178. Dressing our data for the final act
  179. Turning our visual into an interactive app
  180. Adding additional information on hover and click
  181. Changing the hexagon size
  182. Changing the color scale interpolator
  183. Browsing different datasets
  184. Encoding data as hexagon size
  185. Summary
  186. Publishing Your Visualization with Github Pages
  187. What we will publish
  188. Understanding the type of content you can publish
  189. Hosting your code on GitHub
  190. Making sense of some key terms and concepts
  191. Tracking historic changes of your files
  192. Collaborating on a project
  193. Working on project branches
  194. Setting up a GitHub account
  195. Creating a repository
  196. Editing a file on GitHub
  197. Uploading files to the repository
  198. Publishing your project on GitHub Pages
  199. Preparing the files for publishing
  200. Keeping your paths absolute
  201. Changing the main HTML filename to index.html
  202. Publishing your project
  203. Summary

Picking the values

At this point, you have all tools at hands to implement a hover. Now, you will need to make it happen. To wire it all up, you need to do the following steps:

  1. Listen to mousemoves on the main Canvas.
  2. Translate these coordinates to positions on the hidden Canvas.
  3. Pick the color from that position.
  4. Strip out the color value that represents the data array index for your data.
  5. Lean back and think of ways to use it.

Listening on mousemove is easy; you just need to perform the following command:

canvas.on('mousemove', highlightPicking);

Done. The first thing we will do in highlightPicking() is translate the mouse position on the main Canvas to the coordinates on the hidden Canvas:

function highlightPicking() {
var pos = d3.mouse(this);
var longlat = projection.invert(pos);
var hiddenPos = hiddenProjection(longlat);

We first get the x, y mouse coordinates. This will be updated whenever we move the mouse. An example value of the pos variable is [488, 85], which is in the north of France. We use D3’s own projection.invert() which is the inverse of projection(). What does projection() do? It takes an array of [longitude, latitude] values and returns a pair of [x, y] pixel coordinates. Well, projection.invert() does the opposite. It takes a pixel coordinate array and returns the respective longitude and latitude array. In our case, that will be [2.44, 48.81]. The longitude is a bit further right of 0, which is Greenwich, so yes, that seems right. Note, that this projection is our main Canvas projection. Next, we use our hiddenProjection() function to reproject our longlat values to the pixel coordinates of this very place. In our example, hiddenPos gets the pixel coordinates [485.83, 183.17] assigned to it. That’s the very same spot in the north of France on the hidden Canvas! Exactly what we were after.

To demonstrate this, take a look at the following screenshots:

Translating the main Canvas mouse coordinates to the hidden Canvas coordinates

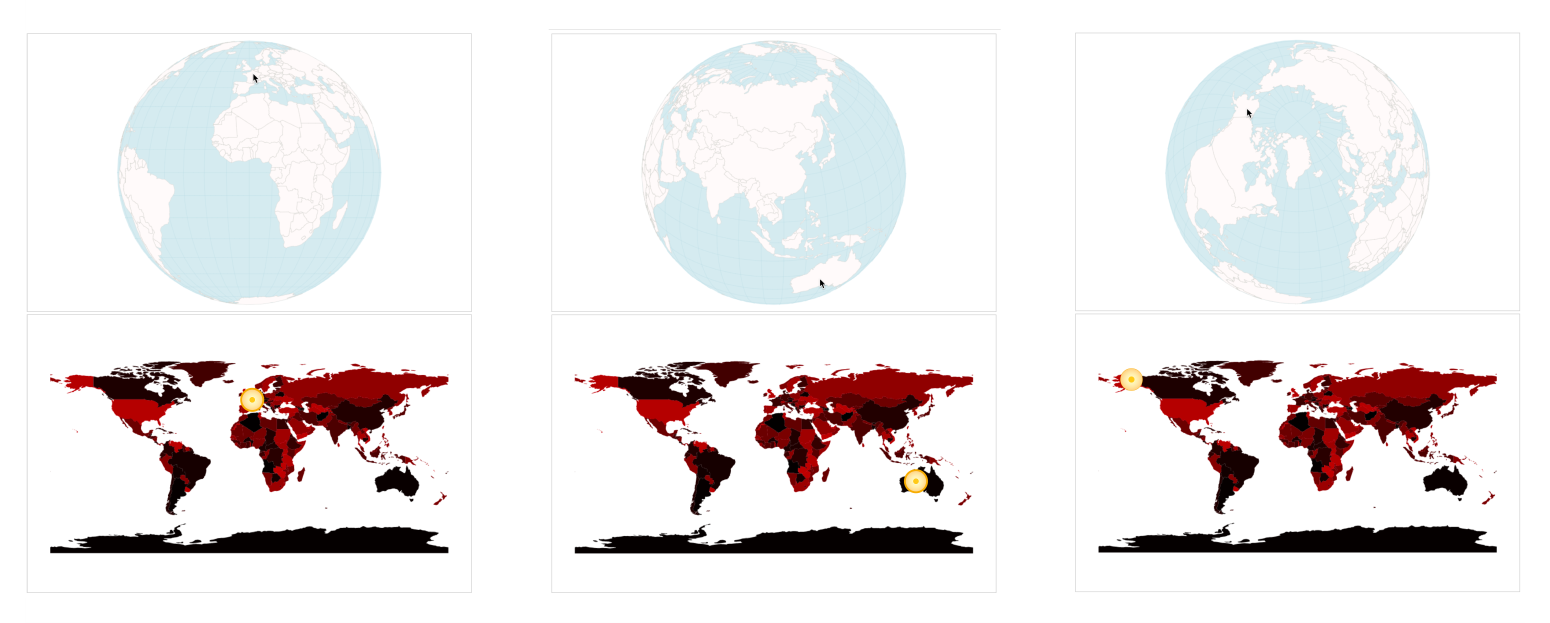
Our mouse position on the upper main Canvas represented by pos gets translated to the lower orange circle represented by the hiddenPos variable.

Now, we finally get to pick that color:

var pickedColor = hiddenContext.getImageData(hiddenPos[0], hiddenPos[1], 1, 1).data;

This returns a special array with the unwieldy name Uint8ClampedArray representing the R, the G, the B, and the alpha value (peculiarly also ranging from 0 to 255) at exactly that pixel. In our case, for example, for France (the left most pick in the preceding screenshot), the color is 52:

The picked color array

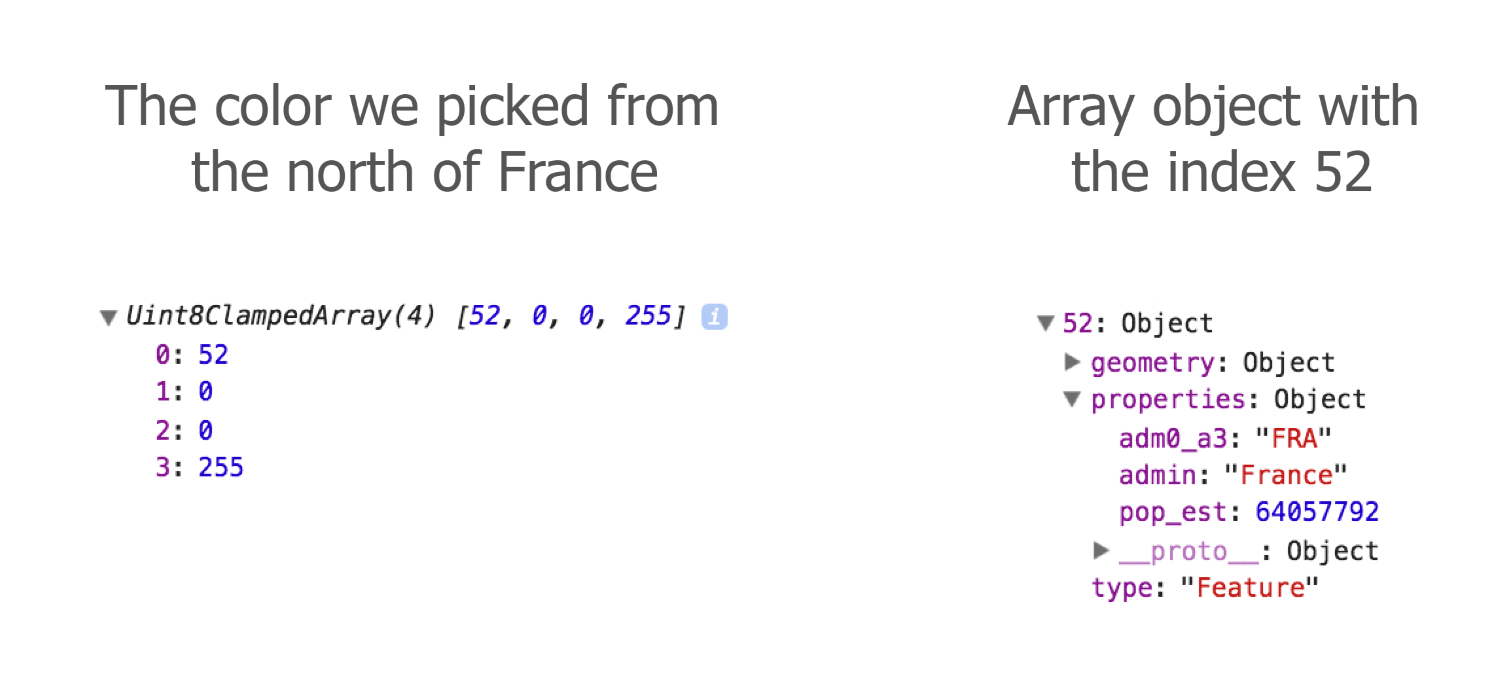
Cross-checking with our countries array, we can confirm that the array element with the index 52 is France.

However, we will build in two security checks before we can be sure of hovering over a country. First, you will check whether the user’s mouse is on the globe and not somewhere in the outer space:

var inGlobe =
Math.abs(pos[0] - projection(projection.invert(pos))[0]) < 0.5 &&
Math.abs(pos[1] - projection(projection.invert(pos))[1]) < 0.5;

In an ideal world, for our purpose, projection.invert(pos) above would return undefined or similar when we move beyond the globe; however, it still returns actual pixel coordinates, which is not what we want. The problem is that projection.invert() is not bijective, meaning it can in fact return the same [long, lat] coordinates for different pixel position inputs. This is especially the case when we move the mouse beyond the globe bounds. To alleviate this issue, we do a so called forward projection here. This just means that we project the inverse of our projection. We take in the pixel coordinates, translate them to [long, lat] values and project them back to pixel coordinates. If our mouse is within the globe, this will return our exact mouse position (in fact we give it a leeway of +/- 0.5 pixels here). If our mouse is outside the globe, the forward projection will deviate from our mouse position in pixel.

The second check we perform is to make sure that our mouse is over a country and not a country border:

selected = inGlobe && pickedColor[3] === 255 ? pickedColor[0] : false;

Let’s take this one by one. selected will hold the index. You will, however, only get the index if the user’s mouse is inside the globe (inGlobe === true). This is our first check. Secondly, the fourth element of our special pickedColor array has to be exactly 255. Otherwise, selected will be false. This second check is to surpass antialiasing effects.

Why do we need that? The problem with pixels in browsers is that they outsmart us. Lines are feathered at the edges to allow the impression of a smooth transition from line to background:

An aliased line above an antialiased line

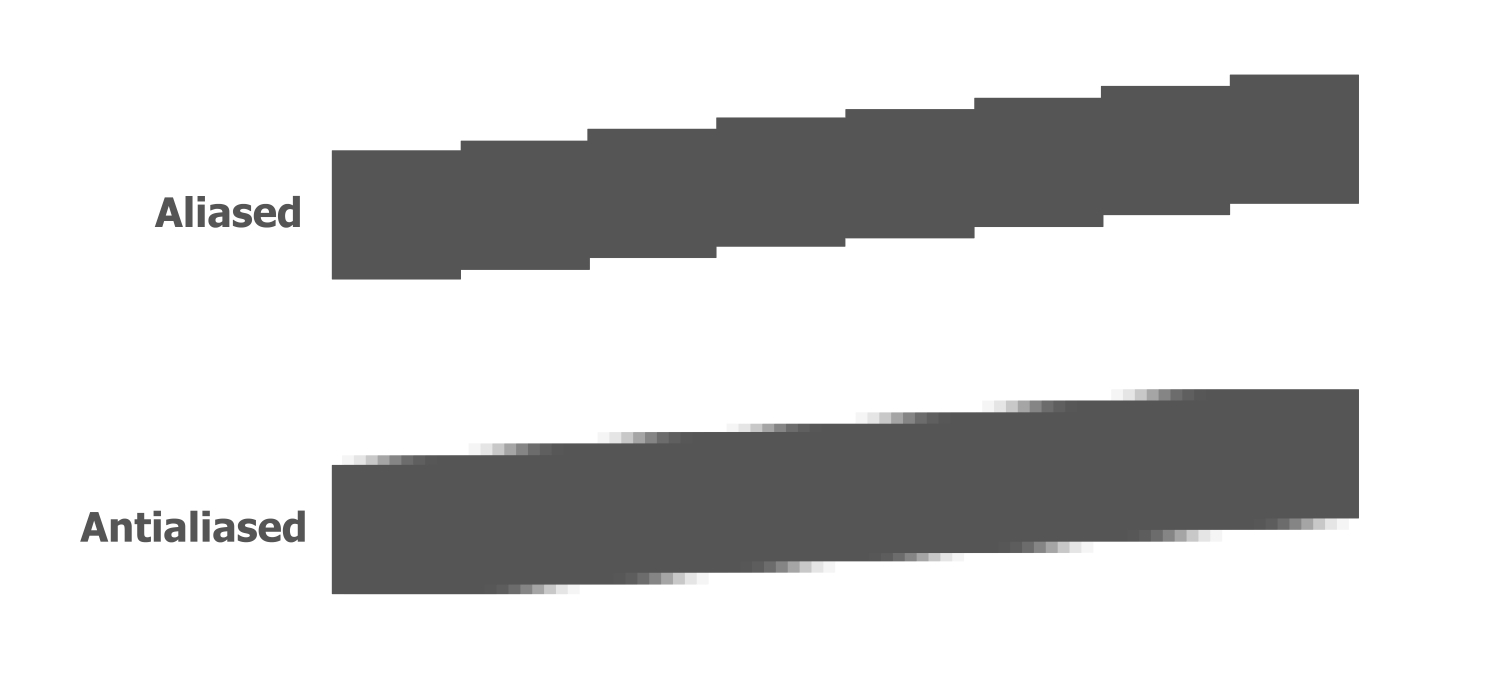
Picking values at these feathered edges would not return fully opaque colors, but transparent values of varying degree. These values have an alpha channel lower than 255, so checking for our alpha to be 255 allows us to pick only from aliased areas.

Fabulous! We’ve built ourself a second Canvas that functions as a memory of the objects on our main data. Next, we’ll use it. The Canvas way of changing anything with our elements and objects is to pass the information to the redrawing part of our app to use it in there accordingly.