
There’s just a single simple function that does what you need in this step:
function drawHiddenCanvas(world) {
  var countries = world.features;
  countries.forEach(function(el, i) {
    hiddenContext.beginPath();
    hiddenPath(el);
    hiddenContext.fillStyle = 'rgb(' + i + ',0,0)';
    hiddenContext.fill();
  });
}
The only argument—world—is our GeoJSON feature collection. countries pulls out just the array of country information, including the polygons and the additional data we’re after. We loop through all of them, drawing each country with the hiddenContext and — most importantly—we gave each country a color using the rgb(<country index>, 0, 0) pattern.
Here we have it! A graph-like structure of our Canvas visual, representing our data.
So far, it’s only a function, so let’s invoke it. We only need to call drawHiddenCanvas() once whenever we have the data available. So, we venture to the ready() function and invoke it right after we draw the main Canvas with renderScene():
  requestAnimationFrame(function() {
    renderScene(countries);
    drawHiddenCanvas(countries);
  });
Here they are; our two worlds:
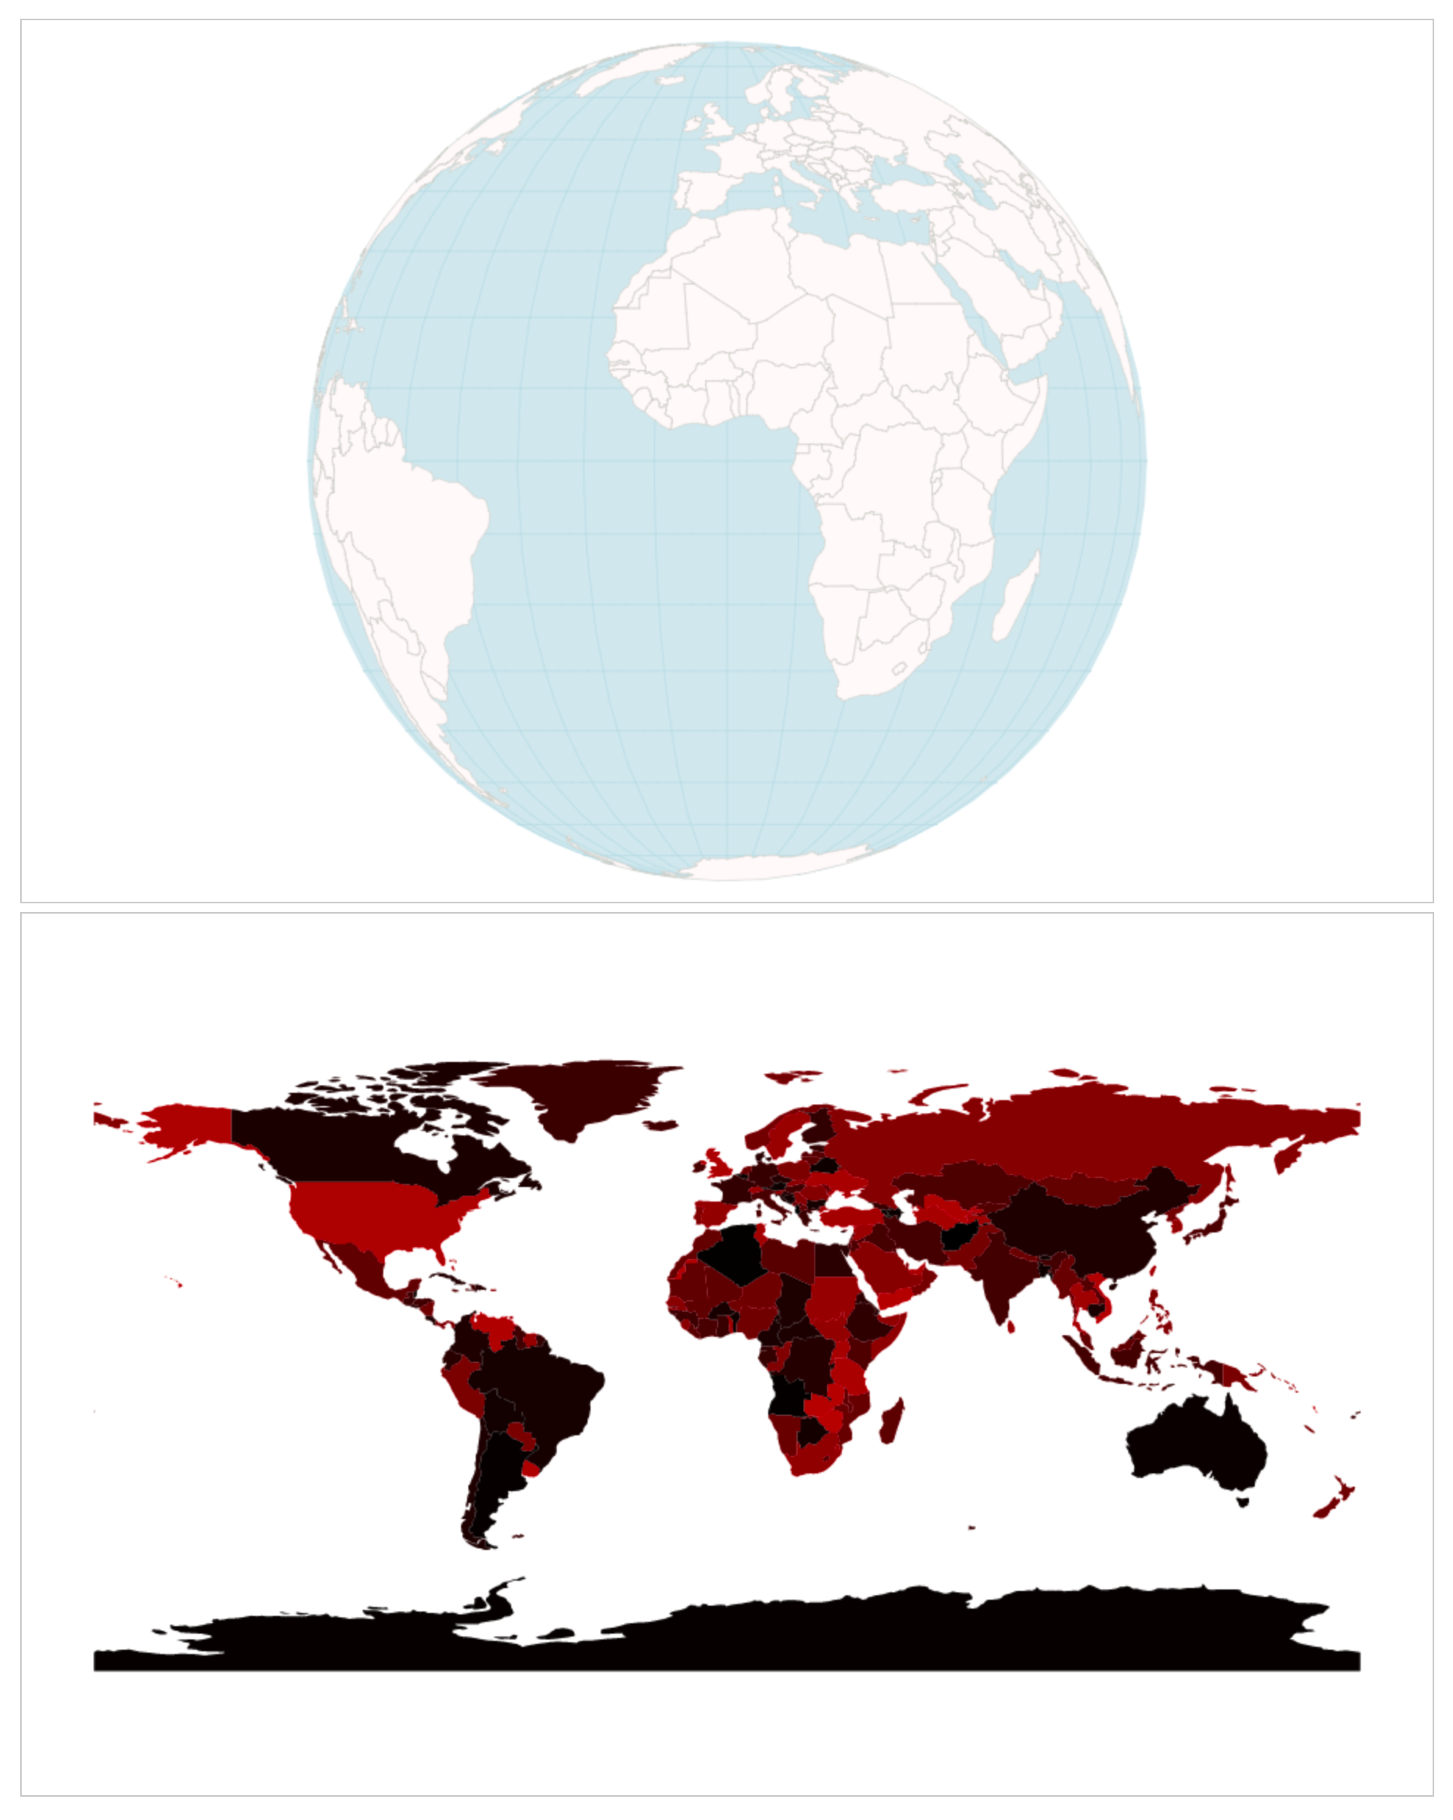
Each country has a slightly different color, ranging from black to red or from rgb(0,0,0) = Afghanistan to rbg(176,0,0) = Zimbabwe. You can see how countries that start high up in the alphabet—Antarctica, Australia, Brasil, or Canada—are much darker than countries that are low down in the alphabet—the United States or Russia. Note that we’ll keep our hidden Canvas visible for demonstration purposes, but, in production, we can just add the CSS rule { display: hidden } to hide our Canvas. No one needs to know about our little trick.