
In this section, we will walk through the basics of creating a standard map.
The example can be viewed by opening the example-1.html file of this chapter provided with this book. If you already have the HTTP server running, you can point your browser to http://localhost:8080/chapter-4/example-1.html. On the screen is Mexico (Oscar's beloved country)!
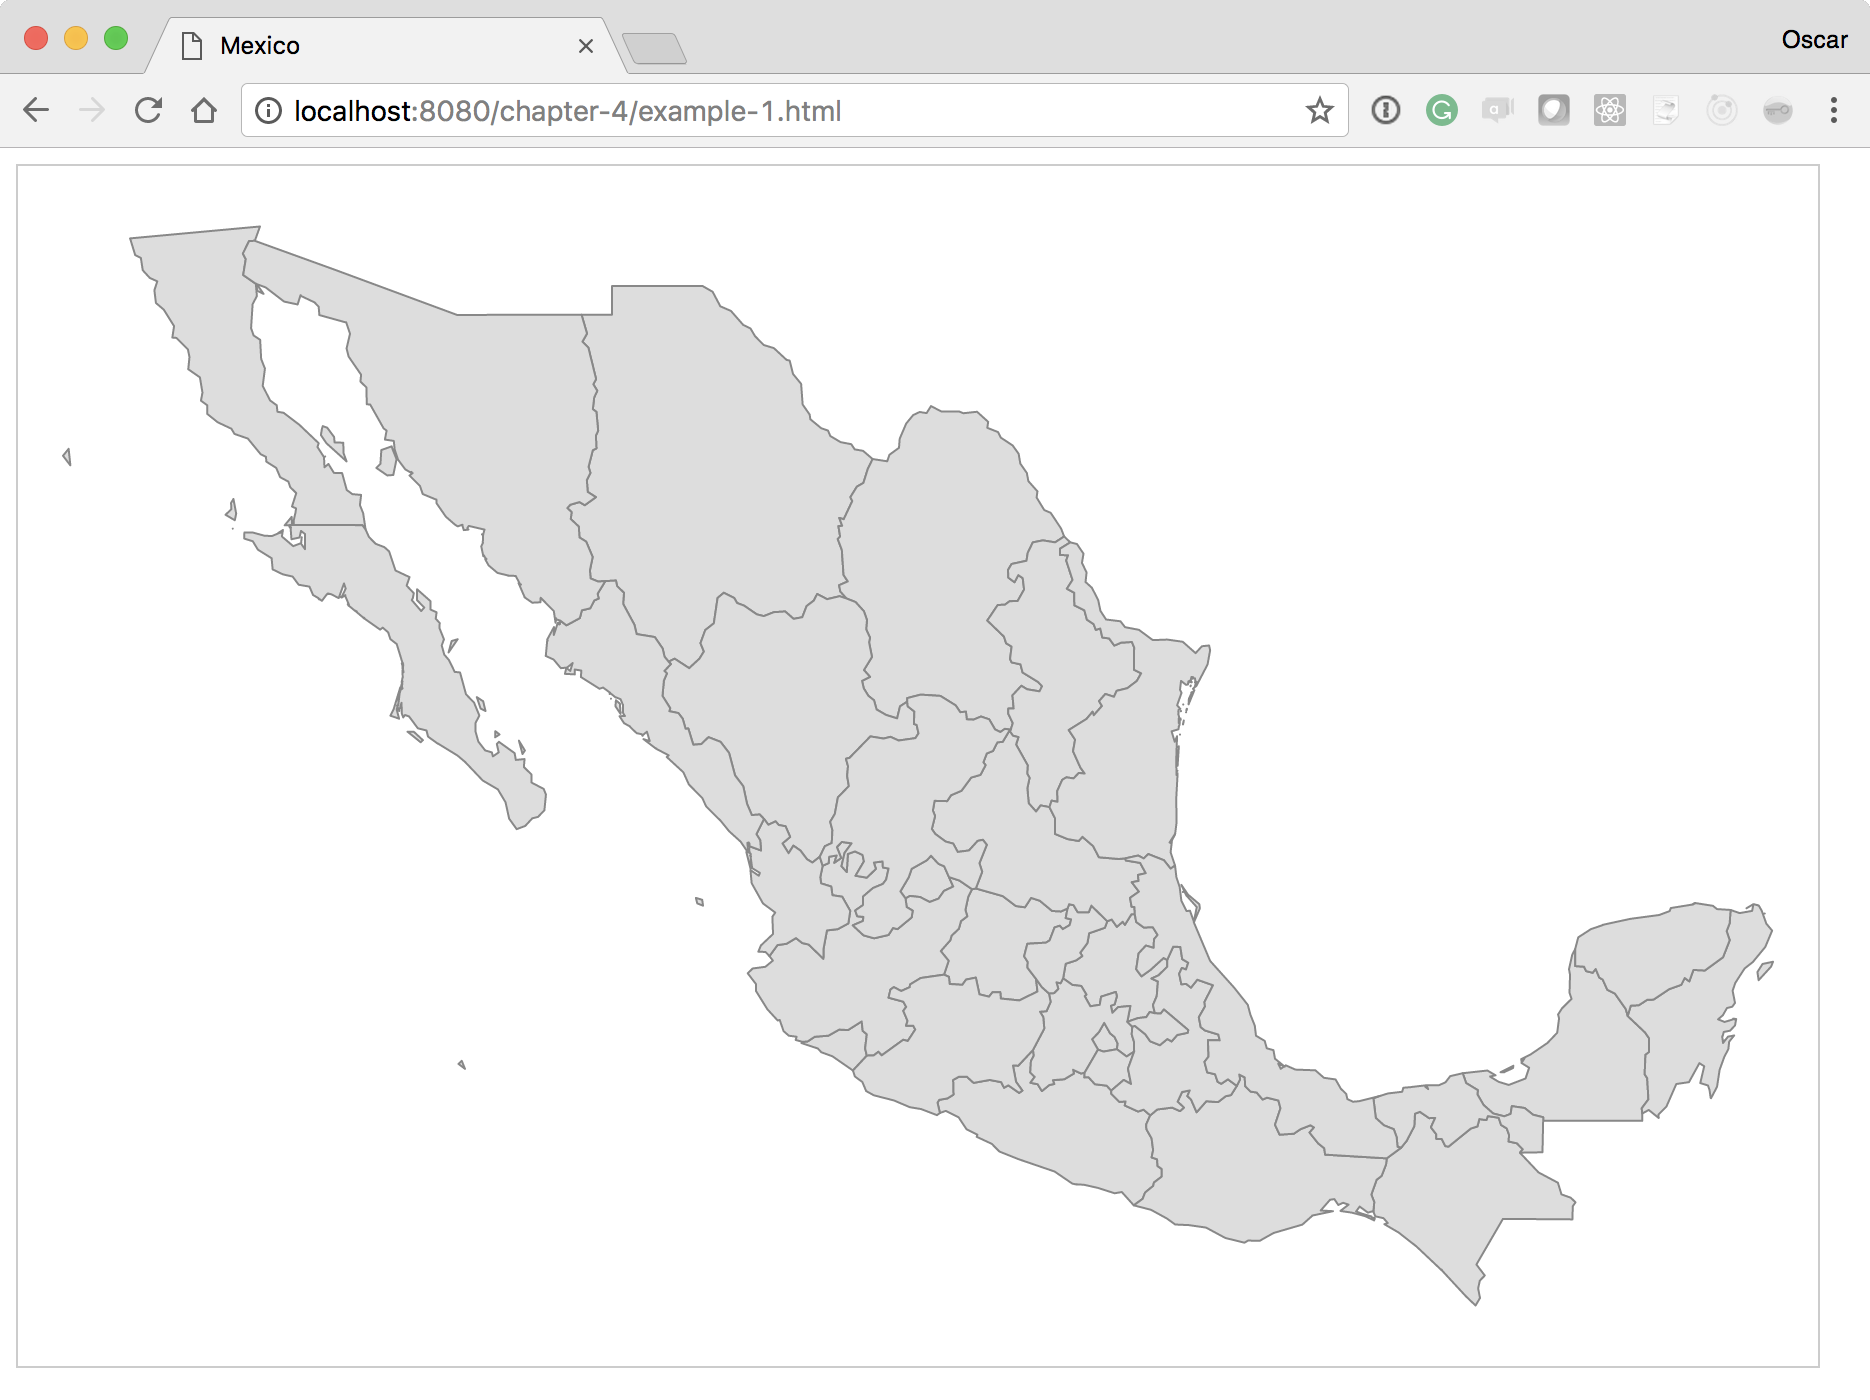
Let's walk through the code to get a step-by-step explanation of how to create this map.
The width and height can be anything you want. Depending on where your map will be visualized (cellphones, tablets, or desktops), you might want to consider providing a different width and height:
var height = 600;
var width = 900;
The next variable defines a projection algorithm that allows you to go from a cartographic space (latitude and longitude) to a Cartesian space (x, y)—basically a mapping of latitude and longitude to coordinates. You can think of a projection as a way to map the three-dimensional globe to a flat plane. There are many kinds of projections, but geoMercator() is normally the default value you will use:
var projection = d3.geoMercator();
var mexico = void 0;
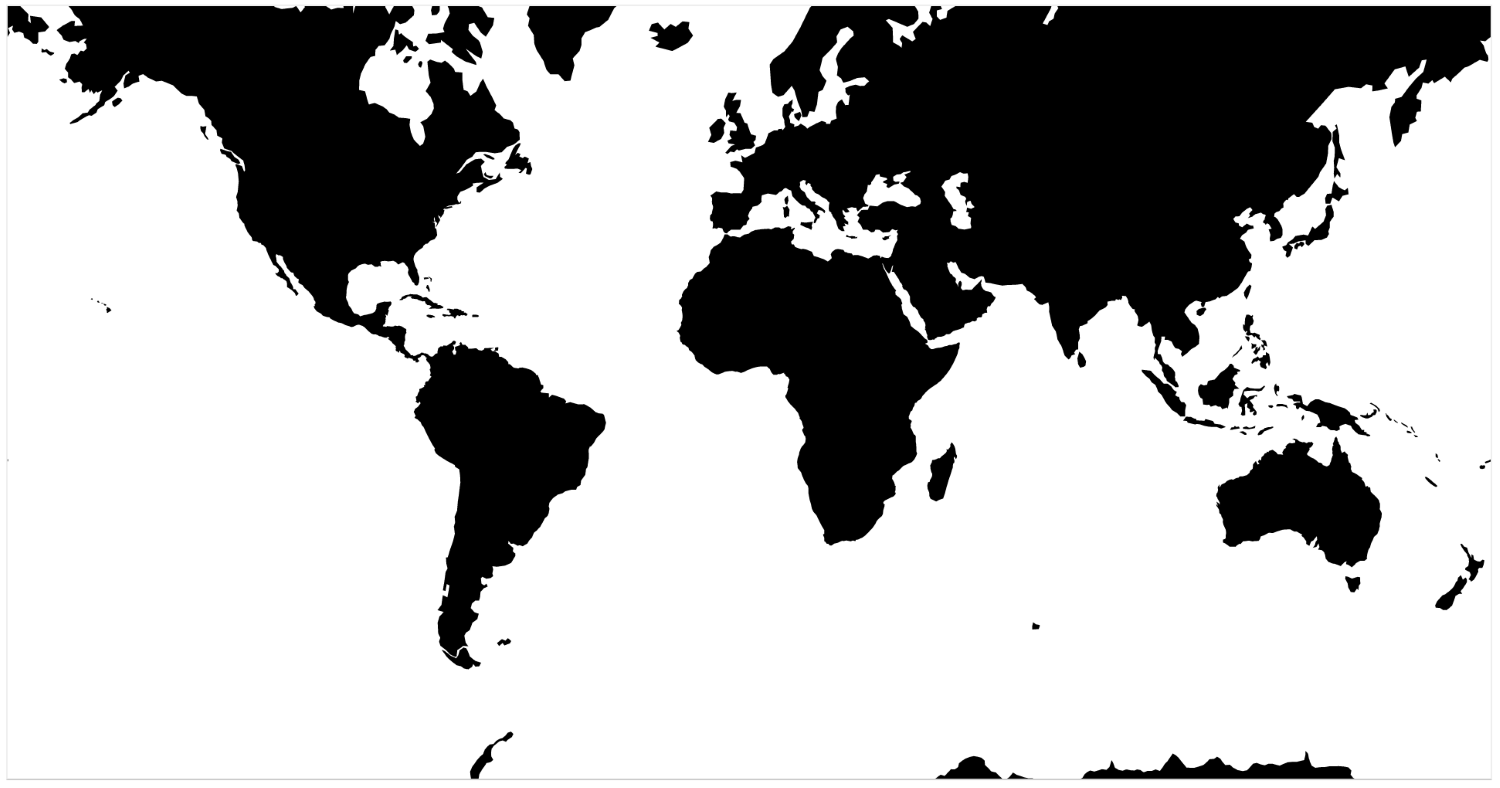
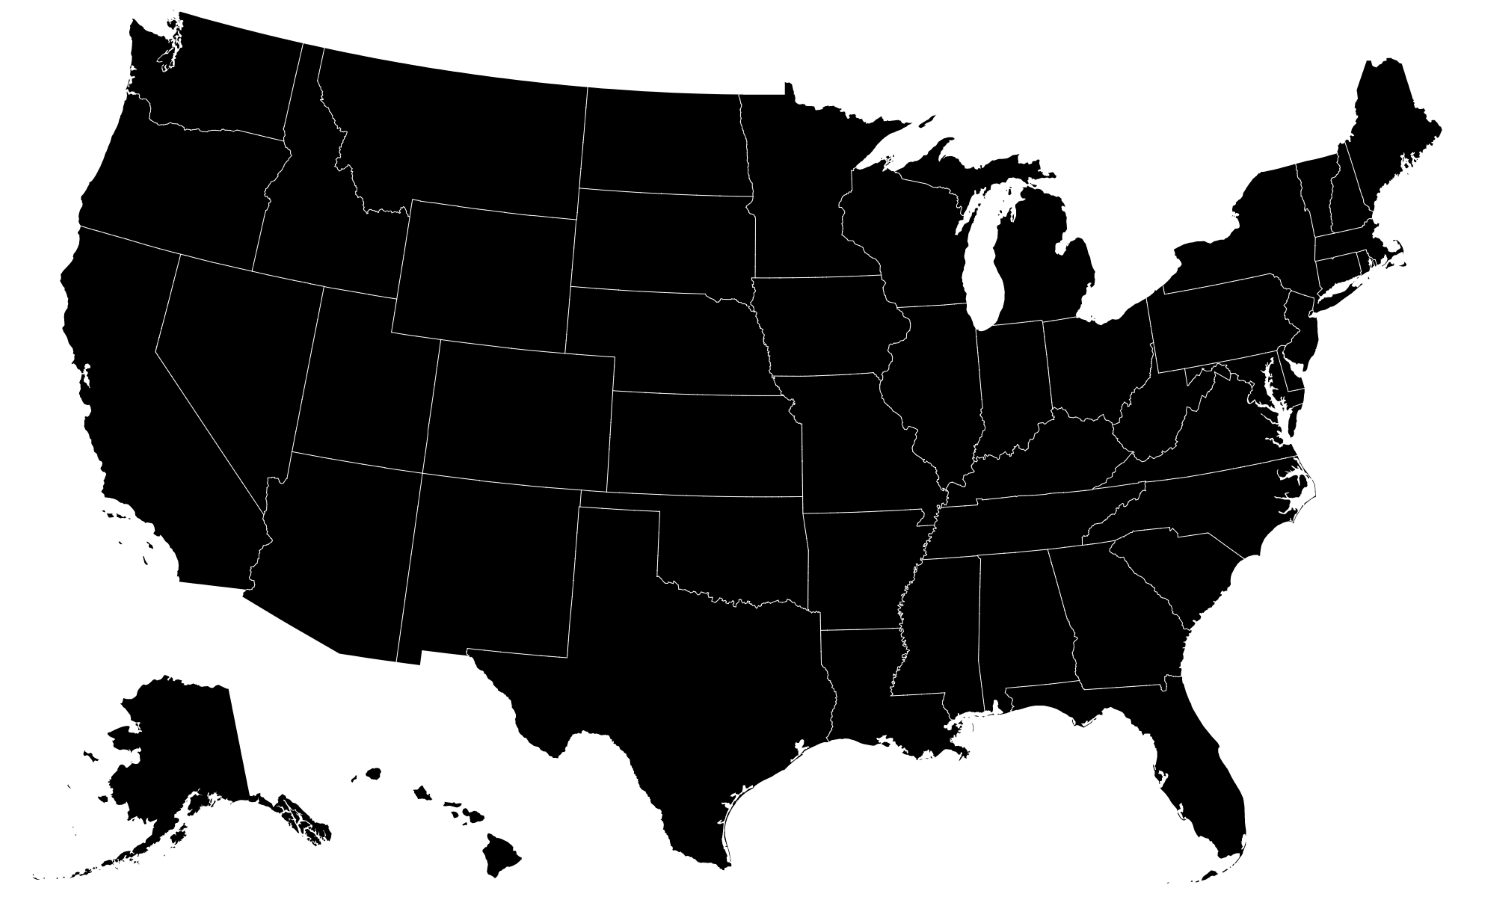
If you were making a map of the USA, you could use a better projection called AlbersUsa. This is to better position Alaska and Hawaii. By creating a geoMercator() projection, Alaska would render proportionate to its size, rivaling that of the entire US. The geoAlbersUsa() projection grabs Alaska, makes it smaller, and puts it at the bottom of the visualization. The following screenshot is of geoMercator():
This next screenshot is of geoAlbersUsa():
The D3 library currently contains many built-in projection algorithms. An overview of each one can be viewed at https://github.com/d3/d3-geo/blob/master/README.md#projections.
Next, we will assign the projection to our geoPath() function. This is a special D3 function that will map the JSON-formatted geographic data into SVG paths. The data format that the geoPath() function requires is named GeoJSON and will be covered in Chapter 6, Finding and Working with Geographic Data:
var path = d3.geoPath().projection(projection);
var svg = d3.select("#map")
    .append("svg")
    .attr("width", width)
    .attr("height", height);