
Let's add some other basic geometric shapes or graphical primitives to our canvas. As they are the building blocks of all the visuals you draw, some exercise will do us good. Here's what we will draw:
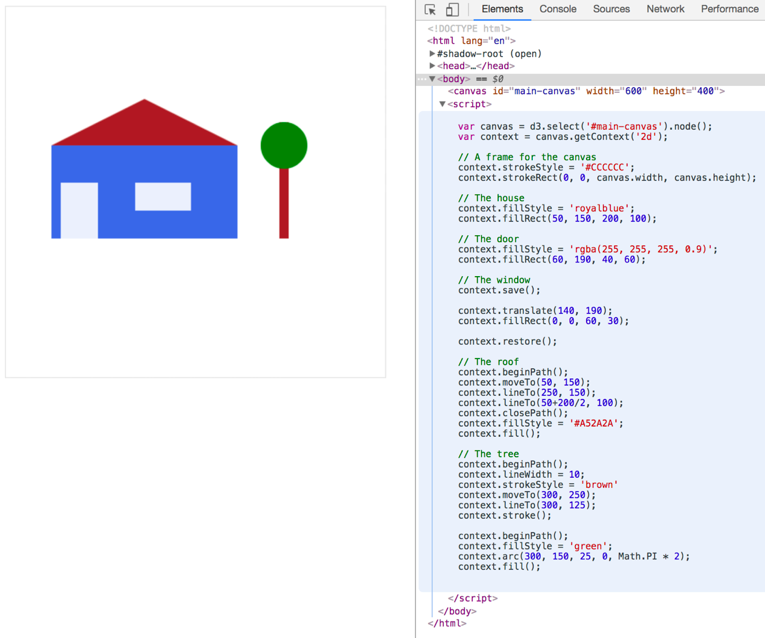
You can see the code to the right in the JavaScript console, and before we step through it, let's note some general observations. First, every line starts with context. The Canvas context is really where our drawing comes to life. Second, Canvas code is written in a procedural style. This can be a benefit for beginners, as it is linear. No callbacks, no nested element structure, just a straight line of execution. This linearity will also extend to time, once you start animating the canvas. You write the first frame first, then you change the scene, then you write the second frame. Flip-book simple. Let's step through the code and see how to create these elements in detail. The first thing I suggest is giving the canvas a border. As the canvas element is an HTML element, you can style it with CSS, but we use JavaScript here to show off two properties of the canvas itself: width and height:
context.strokeStyle = '#CCCCCC';
context.strokeRect(0, 0, canvas.width, canvas.height);
The width and height are the only properties the canvas element has. We use them here to read the values of the element, however, they are readable and writable. This is nice, as you can change the canvas size programmatically when you want to resize your canvas during animation for example. Next, we build our flat-roofed blue house:
context.fillStyle = 'royalblue';
context.fillRect(50, 150, 200, 100);
Not much to see here, we've done that previously. The door won't make you sweat either, as it's the same as the house with a different color:
context.fillStyle = 'rgba(255, 255, 255, 0.9)';
context.fillRect(60, 190, 40, 60);
However, we use a different method to describe the color. You can use all CSS color concepts like named color values and hex color values, as well as the rgb(), rgba(), hsl() and hsla() color methods. The window is placed a little differently with context.translate():
context.save();
context.translate(140, 190);
context.fillRect(0, 0, 60, 30);
context.restore();
In this case, we don't move the rectangle, we move the entire coordinate system! The translate() method takes two arguments: the x and the y position you want to move the coordinate system by. You know this concept already from the use of transform, translate(x,y) which is often used to move svg:g elements in D3 and create their own coordinate systems. However, when applied to an svg:g element the transformed coordinate system applies to all objects nested within the g element. As said above, the g element, as well as its children, is retained as a scene-graph representation in the DOM, including its coordinate system. In Canvas, we can't move this information off to a representation of our drawing – there is no such thing. It's up to you to make sure only elements you want to manifest on a different coordinate system will do so. Remember above when we talked about the procedural style of writing Canvas code? This is exactly what we have to keep in mind here. When we change something in the context it will persist through our code until we change it again. To change the coordinate system back we could alternatively move it to our desired position and move it back afterwards like:
context.translate(140, 190);
context.fillRect(0, 0, 60, 30);
context.translate(-140, -190);
But we rather use the generally applicable context.save() and context.restore() methods. The context.save() saves the state at this point of the code and pushes it onto a stack, and context.restore() pops the last saved state off the stack and restores the previous state of the context. If you haven't come across stacks so far, here's an image explaining what it does:
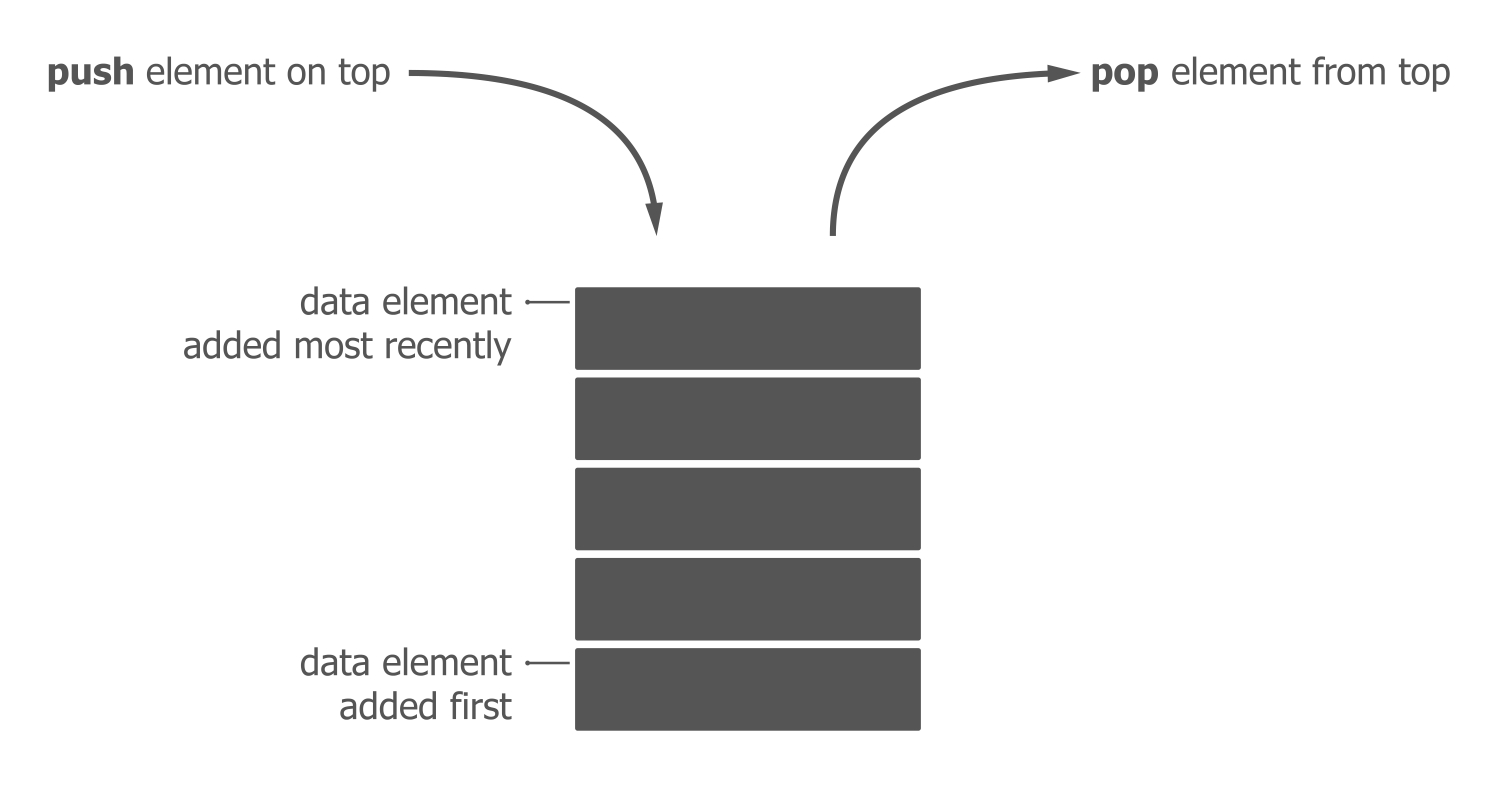
In short, a stack is a datatype like an array or an object. However, a stack is limited to two operations: adding elements on top of the stack (push) and removing elements from the top of the stack (pop). It's like a brick tower. This care-taking of our application's state is a defining aspect of Canvas and a key difference to SVG.
Next, we give the house a triangular roof. There's no triangle() function in Canvas, so you draw a path:
context.beginPath();
context.moveTo(50, 150);
context.lineTo(250, 150);
context.lineTo(50+200/2, 100); // you can use calculations as inputs!
context.closePath();
context.fillStyle = '#A52A2A';
context.fill();
Finally, we draw the tree. A tree has a brown stem, which you implement as a straight path, and a green treetop, which you draw as a green circle:
context.beginPath();
context.lineWidth = 10;
context.strokeStyle = 'brown'
context.moveTo(300, 250);
context.lineTo(300, 200);
context.stroke();

context.beginPath();
context.fillStyle = 'green';
context.arc(300, 175, 25, 0, Math.PI * 2);
context.fill();
There are two things to note here. First, all path code blocks are bracketed by beginPath() and either stroke() (the stem) or fill() (the roof and treetop):
context.beginPath();
// configure your path here
context.stroke();

context.beginPath();
// configure your path here
context.fill();
beginPath() signifies the intent to draw a new path and removes all current path (or sub-path) implementations. stroke() and fill() signify the end of the path and will produce the path on the screen. fill() will fill the path body with the set fillStyle color, and stroke() will only draw the path contour in with the set strokeStyle() method. Whenever you draw a path, you will need these start and end methods. In fact, whenever you draw anything you will need them. fillRect() or strokeRect(), as used previously, are just wrappers for beginning a path, drawing a path, and filling or stroking a path. You might have noticed that we only drew two sides of the triangular roof and then used closePath() which connects the current endpoint of the path with the starting point. The fill() method will also close the path for you, but making this explicit is more thorough, more performant and a service to the reader of your code (including yourself). The second thing to note is that even a circle is a path. In fact, the only primitive shape beyond a path offered by the Canvas API is the rectangle. SVG facilitates the use of <rect>, <circle>, <ellipse>, <line>, <polyline>, <polygon>, and <path>, while Canvas only offers paths and rectangles. However, drawing shapes with paths quickly becomes routine. While there is no pre-defined circle, there's the arc() and arcTo() methods, which pretty much do the circle drawing for you. You just need to add color to it and wrap it into the path start and end methods. arc() takes five arguments, the x and the y position, the radius, the start and the end angle of our arc. Both angles are being measured in radians.
A radian? One radian equals 57.3 degrees. Radians are an alternative unit of measurement for angles. They are beloved by mathematicians as they make a lot of sense in geometric calculations. To get a radian, you take the radius of a circle and wrap it around that circle – if you can imagine that the radius line is bendable:
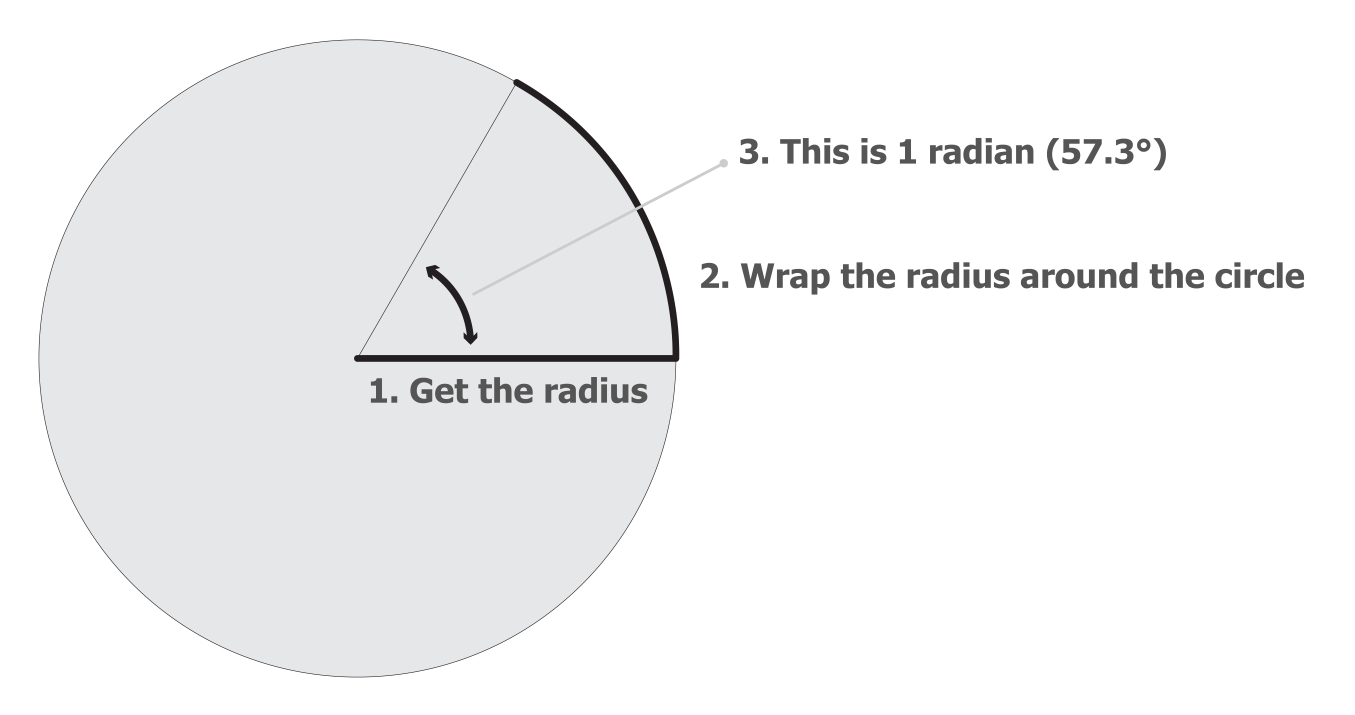
Their mathematical advantage is that they can be derived directly from the radius of a circle. The further beauty is that half a circle (as in 180 degrees) is exactly one PI radians. Hence, a full circle equals 2 * PI radians.
Degrees probably make more sense to you. That's fine. They also make more sense if you want to move objects around on the screen. You can easily convert between radians and degrees by using the following formula: (PI / 180) * degrees. PI is half a circle in radians and 180 is half a circle in degrees. By dividing one by the other, you express one degree in radians, which equals 0.0175. Multiply any degree number you desire with 0.0175 and use the result as radians.
OK! We've drawn a landscape with a house – that's great. There is certainly more to Canvas, but by following these simple steps you have learned a lot. You have learned about the concept of drawing with Canvas and what it means to write your code procedurally. You have seen how to draw individual shapes with Canvas, how you can move individual objects around with a translate transformation, and how the atomic unit of each Canvas shape is the path. Now, let's step it up and animate our landscape the Canvas way before we do it the D3 way.