
The enter() function is a part of every basic D3 visualization. It allows the developer to define a starting point with attached data. The enter() function can be thought of as a section of code that executes when data is applied to the visualization for the first time. Typically, the enter() function will follow the selection of a DOM element. Let's walk through an example (http://localhost:8080/chapter-3/example-2.html):
var svg = d3.select("body")
    .append("svg")
    .attr("width", 200)
    .attr("height", 200);
Create the SVG container as we did earlier, as follows:
svg.selectAll('rect').data([1,2]).enter()
The data function is the way we bind data to our selection. In this example, we are binding a very simple array, [1,2], to the selection <rect>. The enter() function will loop through the [1,2] array and apply the subsequent function calls, as shown in the following code:
.append('rect')
.attr('x', function(d){ return d*20; })
.attr('y', function(d){ return d*50; })
As we loop through each element in the array, we will do the following:
- Append a new rect SVG element
- Position the rect element in coordinates x = d * 20 and y = d * 50 for the element, where d is equal to 1 for the first element and 2 for the second element, as shown in the following code:
.attr("width",50)
.attr("height",100);
We will keep height and width the same:
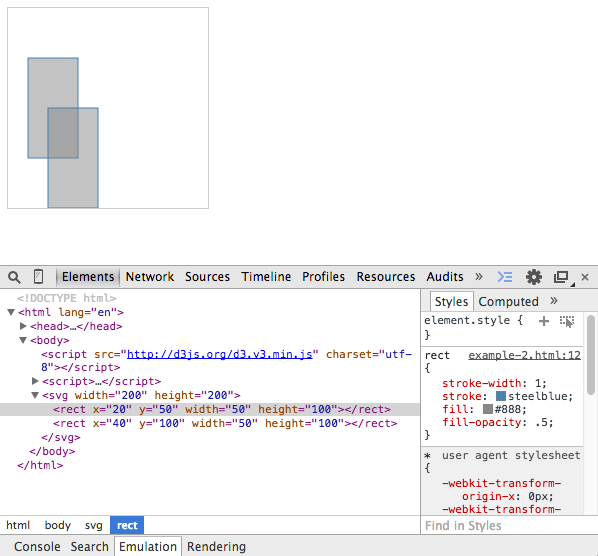
<svg width="200" height="200">
  <rect x="20" y="50" width="50" height="100"></rect>
  <rect x="40" y="100" width="50" height="100"></rect>
</svg>
Look closely; take a peek at the Chrome developer tools. We see two rectangles, each corresponding to one element in our array, as shown in the following screenshot:
Remember, data doesn't necessarily have to be boring numbers, such as 1 or 2. The data array can consist of any data objects. To illustrate this, we will change the previous array to an array of objects in the next example (see http://localhost:8080/chapter-3/example-3.html):
As you can see in the following code snippet, our data array has two objects, each one with four different key-value pairs:
var data = [
  {
    x:10,
    y:10,
    width:5,
    height:40
  },{
    x:40,
    y:10,
    width:100,
    height:40
  }
];

  var svg = d3.select("body")
    .append("svg")
    .attr("width", 200)
    .attr("height", 200);

  svg.selectAll('rect').data(data).enter()
    .append('rect')
    .attr('x', function(d){ return d.x})
    .attr('y', function(d){ return d.y})
    .attr("width", function(d){ return d.width})
    .attr("height", function(d){ return d.height});
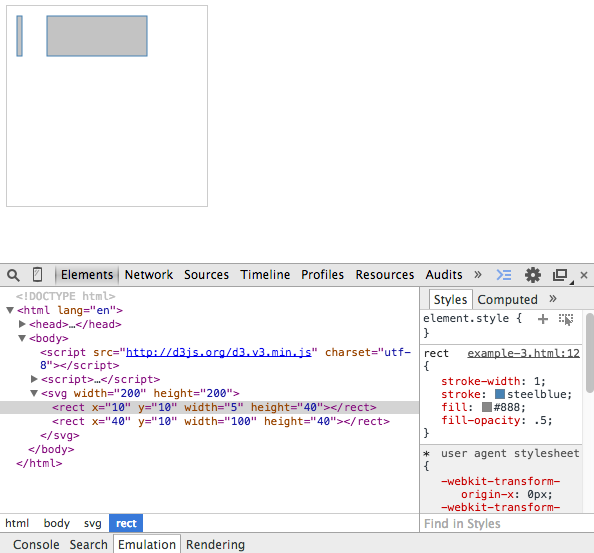
Now, as we loop through each object in the array, we will do the following:
- Still append a new rect SVG element.
- Position and size the rect element by the properties of the object. The first rectangle will be positioned at x=10, y=10, and have a width of 5 and a height of 40. The second rectangle will be positioned at 40, 10, and will have a width of 100 and a height of 40.
- Remember that d represents the datum, or each object within the array, which is why we refer to d.x or d.y to get x and y properties accordingly.