A very common request when working with maps is to provide the ability to pan and zoom around the visualization. This is especially useful when a large map contains abundant detail. Luckily, D3 provides an event listener to help with this feature. In this experiment, we will outline the principles to provide basic panning and zooming for your map. This experiment requires us to start with example-1.html; however, feel free to look at http://localhost:8080/chapter-5/example-3.html for reference.
First, we will add a simple CSS class in our <style> section; this class will act as a rectangle over the entire map. This will be our zoomable area:
.overlay {
fill: none;
pointer-events: all;
}
Next, we need to define a function to handle the event when the zoom listener is fired. The following function can be placed right below the map declaration:
var zoomed = function () {
  map.attr("transform", "translate("+ d3.event.translate + ")
   scale(" + d3.event.scale + ")");
};
This function takes advantage of two variables exposed while panning and zooming: d3.event.scale and d3.event.translate. The variables are defined as follows:
- d3.event.scale: This defines the zoom level in terms of an SVG scale.
- d3.event.translate: This defines the position of the map in relation to the mouse in terms of an SVG translate.
With this information available, we can set the SVG attributes (scale and translate) of the map container to the event variables:
var zoom = d3.behavior.zoom()
    .scaleExtent([1, 8])
    .on("zoom", zoomed);
    .size([width, height]);
Similar to the hover event listener, we need to create a new zoom event listener. Create the preceding function after the zoom() function. Note that there is one additional setting to understand, scaleExtent().
The scaleExtent() setting provides a scale range of the zooming amount. The first element in the array is the maximum that the map can zoom out. The second element in the array is the maximum that the map can zoom in. Remember that 1 is the original size of our map based on our bounding-box formula from Chapter 4, Creating a Map. The minimum value that scaleExtent() can be set to is 0, to zoom out. In example-3.html, alter these numbers to get a feel of how they work. For example, if you change 1 to 5, you will see that the map can zoom out to half its original size.
There are additional settings to this event listener that can be reviewed at: https://github.com/mbostock/d3/wiki/Zoom-Behavior:
svg.append("rect")
      .attr("class", "overlay")
      .attr("width", width)
      .attr("height", height)
      .call(zoom);
Finally, right after the mexico.exit section, we will add a transparent rectangle to the entire visualization and bind the new listener. Remember that the rectangle is using the CSS class we defined at the beginning of the experiment.
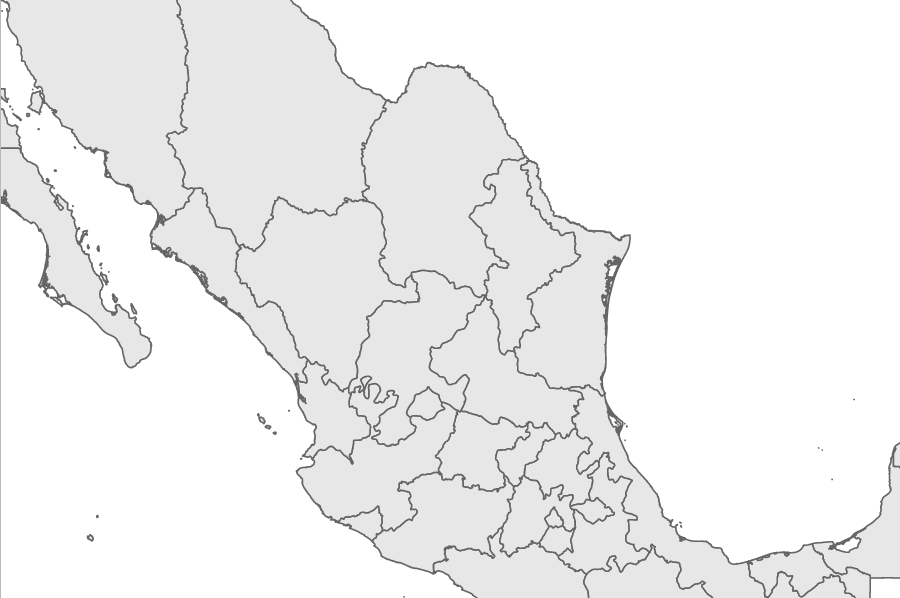
Now, you should have full zooming and panning capabilities on the Mexican map. You can either double-click to zoom in or use your scroll wheel. The interactions should also work for swipe and pinch gestures on a tablet: