For our last example, we will add the ability to drag our globe so that the user can spin it to the left or right. Open http://localhost:8080/chapter-5/example-6.html from the code samples and let's get started:
var dragging = function(d) {
var c = projection.rotate();
projection.rotate([c[0] + d3.event.dx/2, c[1], c[2]])

world.attr('d', path);
mexico.attr('d', path)
        .style('fill', 'lightyellow').style('stroke', 'orange');
};
Our first piece of new code is our dragging event handler. This function will be executed every time the user drags the mouse on the screen. The algorithm executes the following steps:
- Stores the current rotation value.
- Updates the projection's rotation based on the distance it is dragged.
- Updates all the paths in the world map.
- Updates all the paths in the map of Mexico.
The second step deserves a little more explanation. Just like the d3.behavior.zoom event handler, d3.behavior.drag exposes information about the performed action. In this case, d3.event.dx and d3.event.dy indicate the distance dragged from the previous location. The c[0] + d3.event.dx/2 code tells us that we need to take the previous yaw value and add the amount of drag the user is performing. We will divide the drag amount by two to slow down the rotation by half; otherwise, every pixel the user drags will correlate to 1 degree of rotation:
var drag = d3.behavior.drag()
    .on("drag", dragging);
Next, we will bind our dragging method to our drag event, as we saw earlier, with click, hover, and zoom:
svg.append("rect")
      .attr("class", "overlay")
      .attr("width", width)
      .attr("height", height)
      .call(drag);
Finally, we need an area to bind our drag event. Using our previous technique, we will add a transparent rectangle on top of the visualization. This will allow us to very clearly detect the x and y positions on our SVG element.
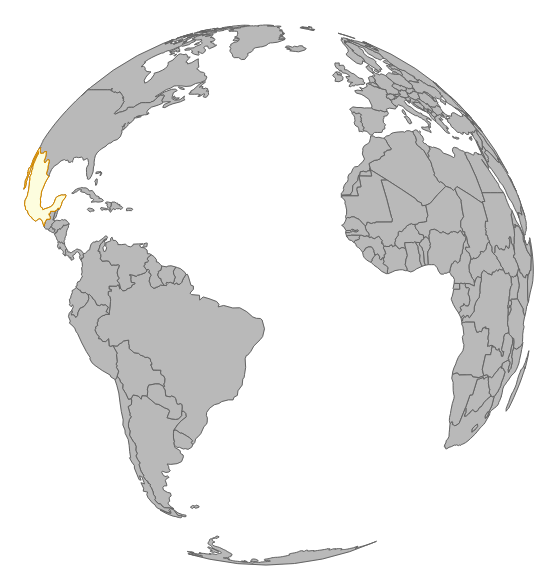
Give it a spin! You'll notice that if you click-and-drag the world, it will spin in the corresponding yaw direction: