
Tooltips are a helpful exploration technique for most visualizations in order to give the user details on a certain data point or area. In this case, the smallest data units of the app are the hexagons. However, some of the hexagons contain more information that would fit on a tooltip—up to 169 as we’ve seen above. To allow the user to browse the markets per area, we will add a side panel listing all the markets in the hovered hexagon. This is how it could look:
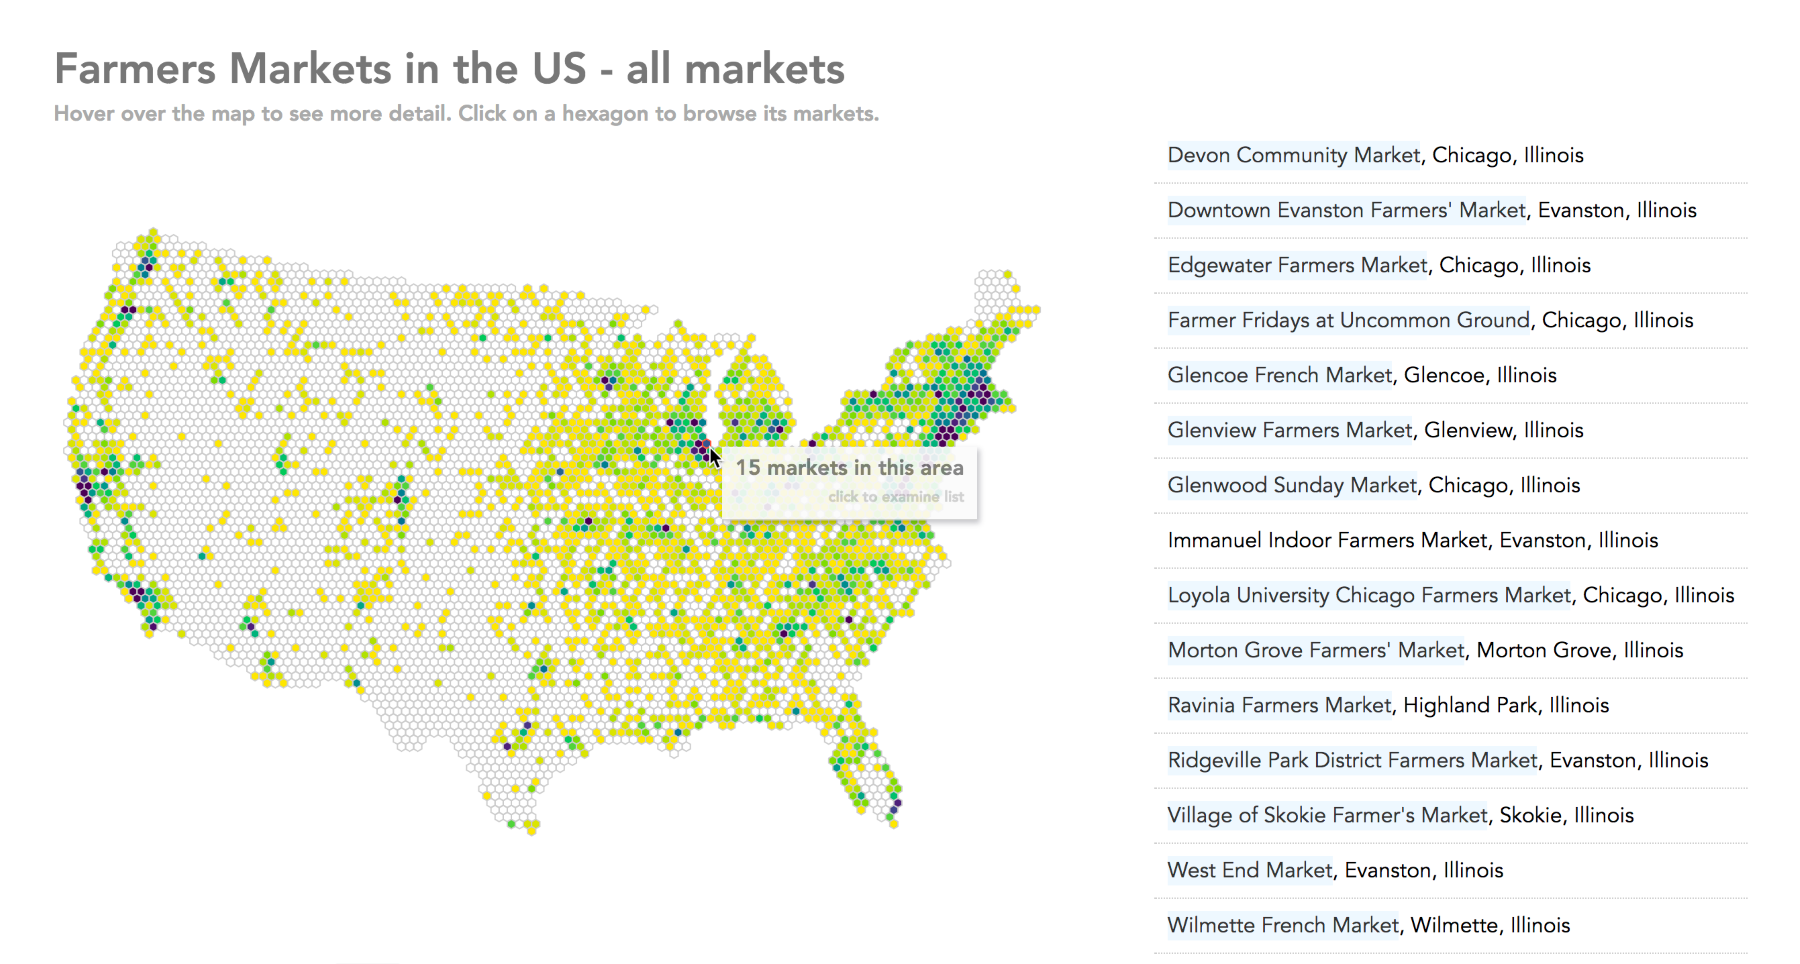
Interactive hexbin map with title, tooltip, and list of markets per hexagon
View this step in the browser at https://larsvers.github.io/learning-d3-mapping-11-8. the and code example at 11_08.html. Please use a recent version of the Chrome browser to view or work along these examples.
The list changes rapidly when the user moves around, so a click on a hexagon would lock the list view so that the user can explore and potentially use the links to get to the markets' websites.