For the next set of experiments in this chapter, we will switch gears and look at interactivity with orthographic projections (representing a three-dimensional map on a two-dimensional screen). A better visualization to illustrate these concepts is the entire globe instead of a single country. This experiment will start with http://localhost:8080/chapter-5/example-4.html and require a new datafile, which is provided for you. You will notice that the code base is almost identical, with the exception of three changes that we will outline here:
var height = 600;
var width = 900;
var projection = d3.geo.orthographic().clipAngle(90);
var path = d3.geo.path().projection(projection);
First, we will change our d3.geo projection from d3.geo.mercator to d3.geo.orthographic. We also have an additional setting to configure: the clipAngle at 90 degrees. This places an imaginary plane through the globe and clips the back of the projection:
d3.json('world.json', function(data) {
var countries = topojson.feature(data, data.objects.countries);
var map = svg.append('g').attr('class', 'boundary');
var world = map.selectAll('path').data(countries.features);
Next, we will substitute the old geo-data.json file for the new datafile, world.json. We will also set up new variables for our data joining in order to provide better readability in the code:
world.enter()
      .append('path')
      .attr('d', path);
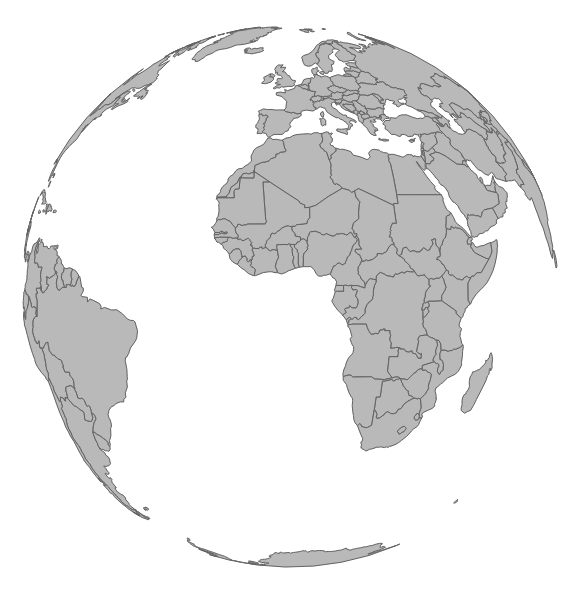
As we have seen many times now, we will apply the standard enter() pattern. You should now have a static map of the globe, as seen in the following screenshot. You can also work directly with example-4.html.
In the last two sections, we will bring the globe to life!