
The necessary data has been provided for you within the data folder, with the filename geo-data.json:
d3.json('geo-data.json', function(data) {
  console.log('mexico', data);
We get the data from an AJAX call, as we saw in the previous chapter.
After the data has been collected, we want to draw only those parts of the data that we are interested in. In addition, we want to automatically scale the map to fit the defined height and width of our visualization.
If you look at the console, you'll see that mexico has an objects property. Nested inside the objects property is MEX_adm1. This stands for the administrative areas of Mexico. It is important to understand the geographic data you are using, because other data sources might have different names for the administrative areas property:
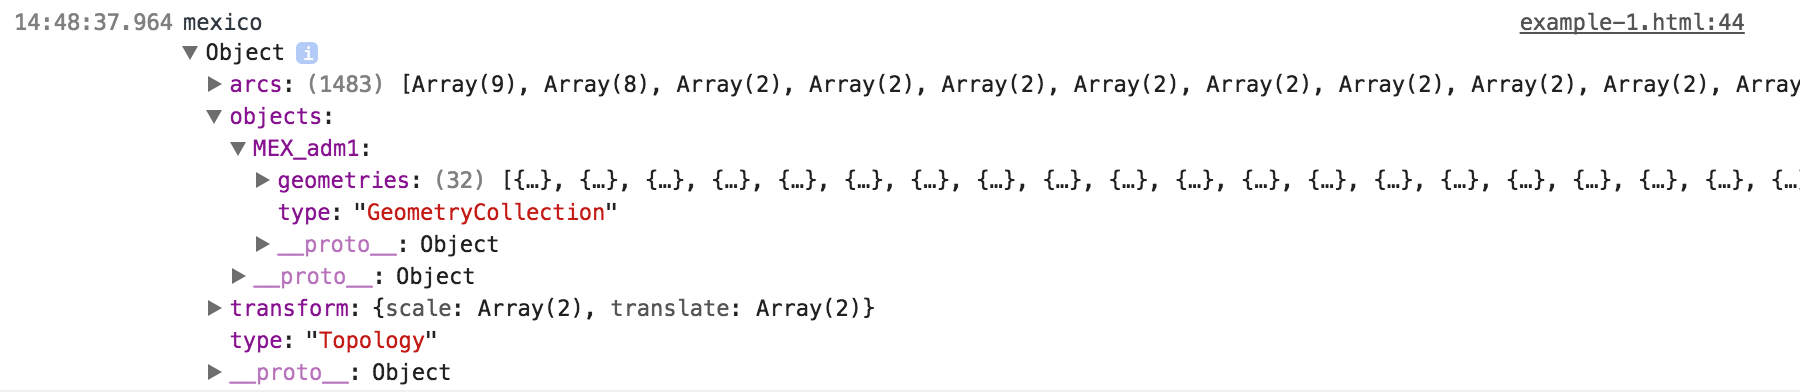
Notice that the MEX_adm1 property contains a geometries array with 32 elements. Each of these elements represents a state in Mexico. Use this data to draw the D3 visualization:
var states = topojson.feature(data, data.objects.MEX_adm1);
Here, we pass all of the administrative areas to the topojson.feature() function in order to extract and create an array of GeoJSON objects. The preceding states variable now contains the features property. This features array is a list of 32 GeoJSON elements, each representing the geographic boundaries of a state in Mexico. We will set an initial scale and translation to 1 and [0,0] respectively:
  // Setup the scale and translate
  projection.scale(1).translate([0, 0]);
This algorithm is quite useful. The bounding box is a spherical box that returns a two-dimensional array of min/max coordinates, inclusive of the geographic data passed:
var b = path.bounds(states);
To quote the D3 documentation:
This is very helpful if you want to programmatically set the scale and translation of the map. In this case, we want the entire country to fit in our height and width, so we determine the bounding box of every state in the country of Mexico.
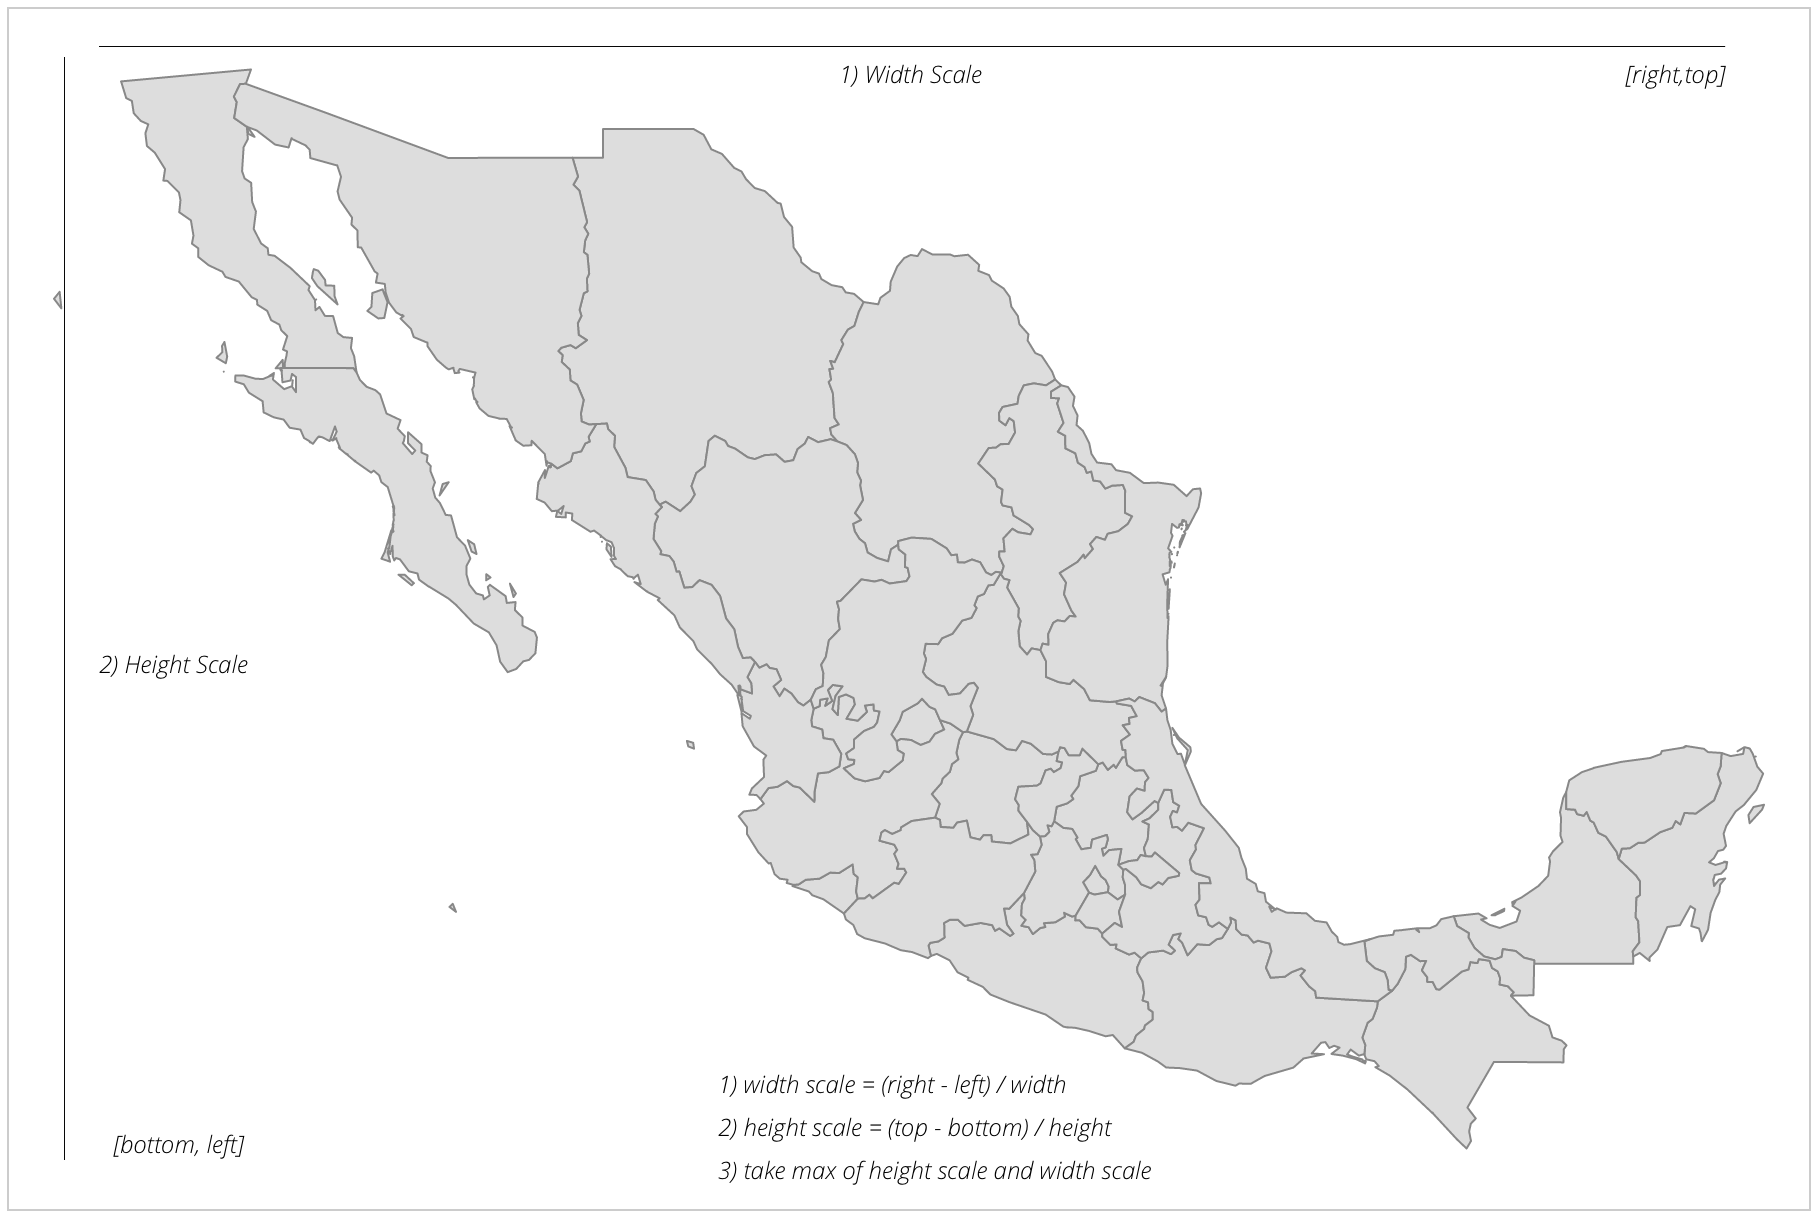
The scale is calculated by taking the longest geographic edge of our bounding box and dividing it by the number of pixels of this edge in the visualization:
var s = .95 / Math.max((b[1][0] - b[0][0]) / width, (b[1][1] -
 b[0][1]) / height);
This can be calculated by first computing the scale of the width, then the scale of the height, and, finally, taking the larger of the two. All of the logic is compressed into the single line given earlier. The three steps are explained in the following image:
The 95 value adjusts the scale because we are giving the map a bit of a breather at the edges in order to not have the paths intersect the edges of the SVG container item, basically reducing the scale by 5%.
Now, we have an accurate scale of our map, given our set width and height:
var t = [(width - s * (b[1][0] + b[0][0])) / 2, (height - s *
 (b[1][1] + b[0][1])) / 2];
As we saw in Chapter 2, Creating Images from Simple Text, when we scale in SVG, it scales all the attributes (even x and y). In order to return the map to the center of the screen, we will use the translate() function.
The translate() function receives an array with two parameters: the amount to translate in x, and the amount to translate in y. We will calculate x by finding the center (topRight - topLeft)/2 and multiplying it by the scale. The result is then subtracted from the width of the SVG element.
Our y translation is calculated similarly but using the bottomRight - bottomLeft values divided by 2, multiplied by the scale, then subtracted from the height.
Finally, we will reset the projection to use our new scale and translation:
projection.scale(s).translate(t);
Here, we will create a map variable that will group all of the following SVG elements into a <g> SVG tag. This will allow us to apply styles and better contain all of the proceeding paths' elements:
var map = svg.append('g').attr('class', 'boundary');
Finally, we are back to the classic D3 enter, update, and exit pattern. We have our data, the list of Mexico states, and we will join this data to the path SVG element:
    mexico = map.selectAll('path').data(states.features);

    //Enter
    mexico.enter()
       .append('path')
       .attr('d', path);
The Enter section and the corresponding path functions are executed on every data element in the array. As a refresher, each element in the array represents a state in Mexico. The path function has been set up to correctly draw the outline of each state, as well as scale and translate it to fit in our SVG container.
Congratulations! You have created your first map!