In this next experiment, we will enhance our tooltips with additional visualizations. In a similar fashion, we will outline the additional code to provide this functionality (http://localhost:8080/chapter-5/example-2.html).
To our CSS, we will need to add the following lines of code:
#tooltip svg{
border-top:0;
margin-left:-5px;
margin-top:7px;
}
This will style our SVG container (inside our tooltip DOM element) to align it with the label of the state.
Next, we'll include two new scripts to create visualizations:
<script src="base.js"></script>
<script src="sparkline.js"></script>
The preceding JavaScript files contain the D3 code for creating a line chart visualization. The chart itself contains and leverages the Towards Reusable Chart described by Mike Bostock at: http://bost.ocks.org/mike/chart/. Feel free to examine the code; it is a very simple visualization that follows the enter, update, and exit pattern. We will explore this chart further in Chapter 7, Testing:
var db = d3.map();
var sparkline = d3.charts.sparkline().height(50).width(138);
We will now declare two new variables. The db variable will hold a hashmap to quickly lookup values by geoID. The sparkline variable is the function that will draw our simple line chart:
var setDb = function(data) {
  data.forEach(function(d) {
    db.set(d.geoID, [
       {"x": 1, "y": +d.q1},
       {"x": 2, "y": +d.q2},
       {"x": 3, "y": +d.q3},
       {"x": 4, "y": +d.q4}
    ]);
  });
};
This function parses data and formats it into a structure that the sparkline function can use to create the line chart:
var geoID = function(d) {
  return "c" + d.properties.ID_1;
};
We will bring back our geoID function from Chapter 4, Creating a Map, in order to quickly create unique IDs for each state:
var hover = function(d) {
  var div = document.getElementById('tooltip');
  div.style.left = event.pageX +'px';
  div.style.top = event.pageY + 'px';
  div.innerHTML = d.properties.NAME_1;

  var id = geoID(d);
  d3.select("#tooltip").datum(db.get(id)).call(sparkline.draw);
};
For our hover event handler, we need to add two new lines. First, we will declare an ID variable that holds the unique geoID for the state we are hovering over. Then, we will call our sparkline function to draw a line chart in the tooltip selection. The data is retrieved from the preceding db variable. For more information on how the call works, refer to: https://developer.mozilla.org/en-US/docs/Web/JavaScript/Reference/Global_Objects/Function/call:
d3.csv('states-data.csv', function(data) {
  setDb(data);
});
We load our .csv file via AJAX and invoke the setDb() function (described earlier).
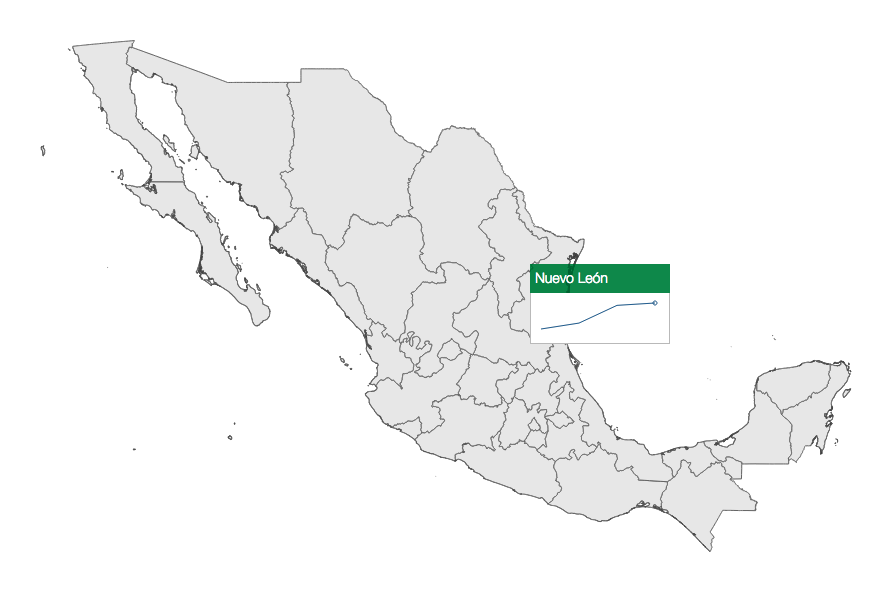
You should now see a map that displays a tooltip with a line chart for every state in Mexico. In summary:
- The map is drawn as usual.
- We will create a small lookup db that contains additional data about each state.
- Then, we will register a hover event that fires whenever the user's mouse passes over a state.
- The hover event fires and retrieves data about the state.
- The hover event also places the name of the state in the DOM and calls a function that creates a line chart with the retrieved data: