We've seen how to make a map and set different colors to the different regions of this map. Next, we will add a little bit of interactivity. This will illustrate a simple reference to bind click events to maps. For this experiment, we will build on the previous exercise, example-3.html. You can see the completed experiment at: http://localhost:8080/chapter-4/example-4.html.
First, we need a quick reference to each state in the country. To accomplish this, we will create a new function called geoID right below the mexico variable:
  var height = 600;
  var width = 900;
  var projection = d3.geoMercator();
  var mexico = void 0;

  var geoID = function(d) {
    return "c" + d.properties.ID_1;
  };
This function takes in a state data element and generates a new selectable ID based on the ID_1 property found in the data. The ID_1 property contains a unique numeric value for every state in the array. If we insert this as an id attribute into the DOM, then we would create a quick and easy way to select each state in the country.
The following is the geoID() function, creating another function called click:
  var click = function(d) {
    d3.selectAll('path').attr('fill-opacity',0.2)
    d3.select('#' + geoID(d)).attr('fill-opacity', 1);
  };
This method makes it easy to separate what the click is doing. The click method receives the datum and changes the fill opacity value of all the states to 0.2. This is done so that when you click on one state and then on the other, the previous state does not maintain the clicked style. Notice that the function call is iterating through all the elements of the DOM using the D3 update pattern. After making all the states transparent, we will set a fill opacity of 1 for the given clicked item. This removes all the transparent styling from the selected state. Notice that we are reusing the geoID() function that we created earlier to quickly find the state element in the DOM.
Next, let's update the enter() method to bind our new click method to every new DOM element that enter() appends:
  //Enter
  mexico.enter()
     .append('path')
     .attr('d', path)
     .attr('id', geoID)
     .on("click", click)
     .attr('fill', function(d,i) { return color(i); })
We also added an attribute called id; this inserts the results of the geoID() function into the id attribute. Again, this makes it very easy to find the clicked state.
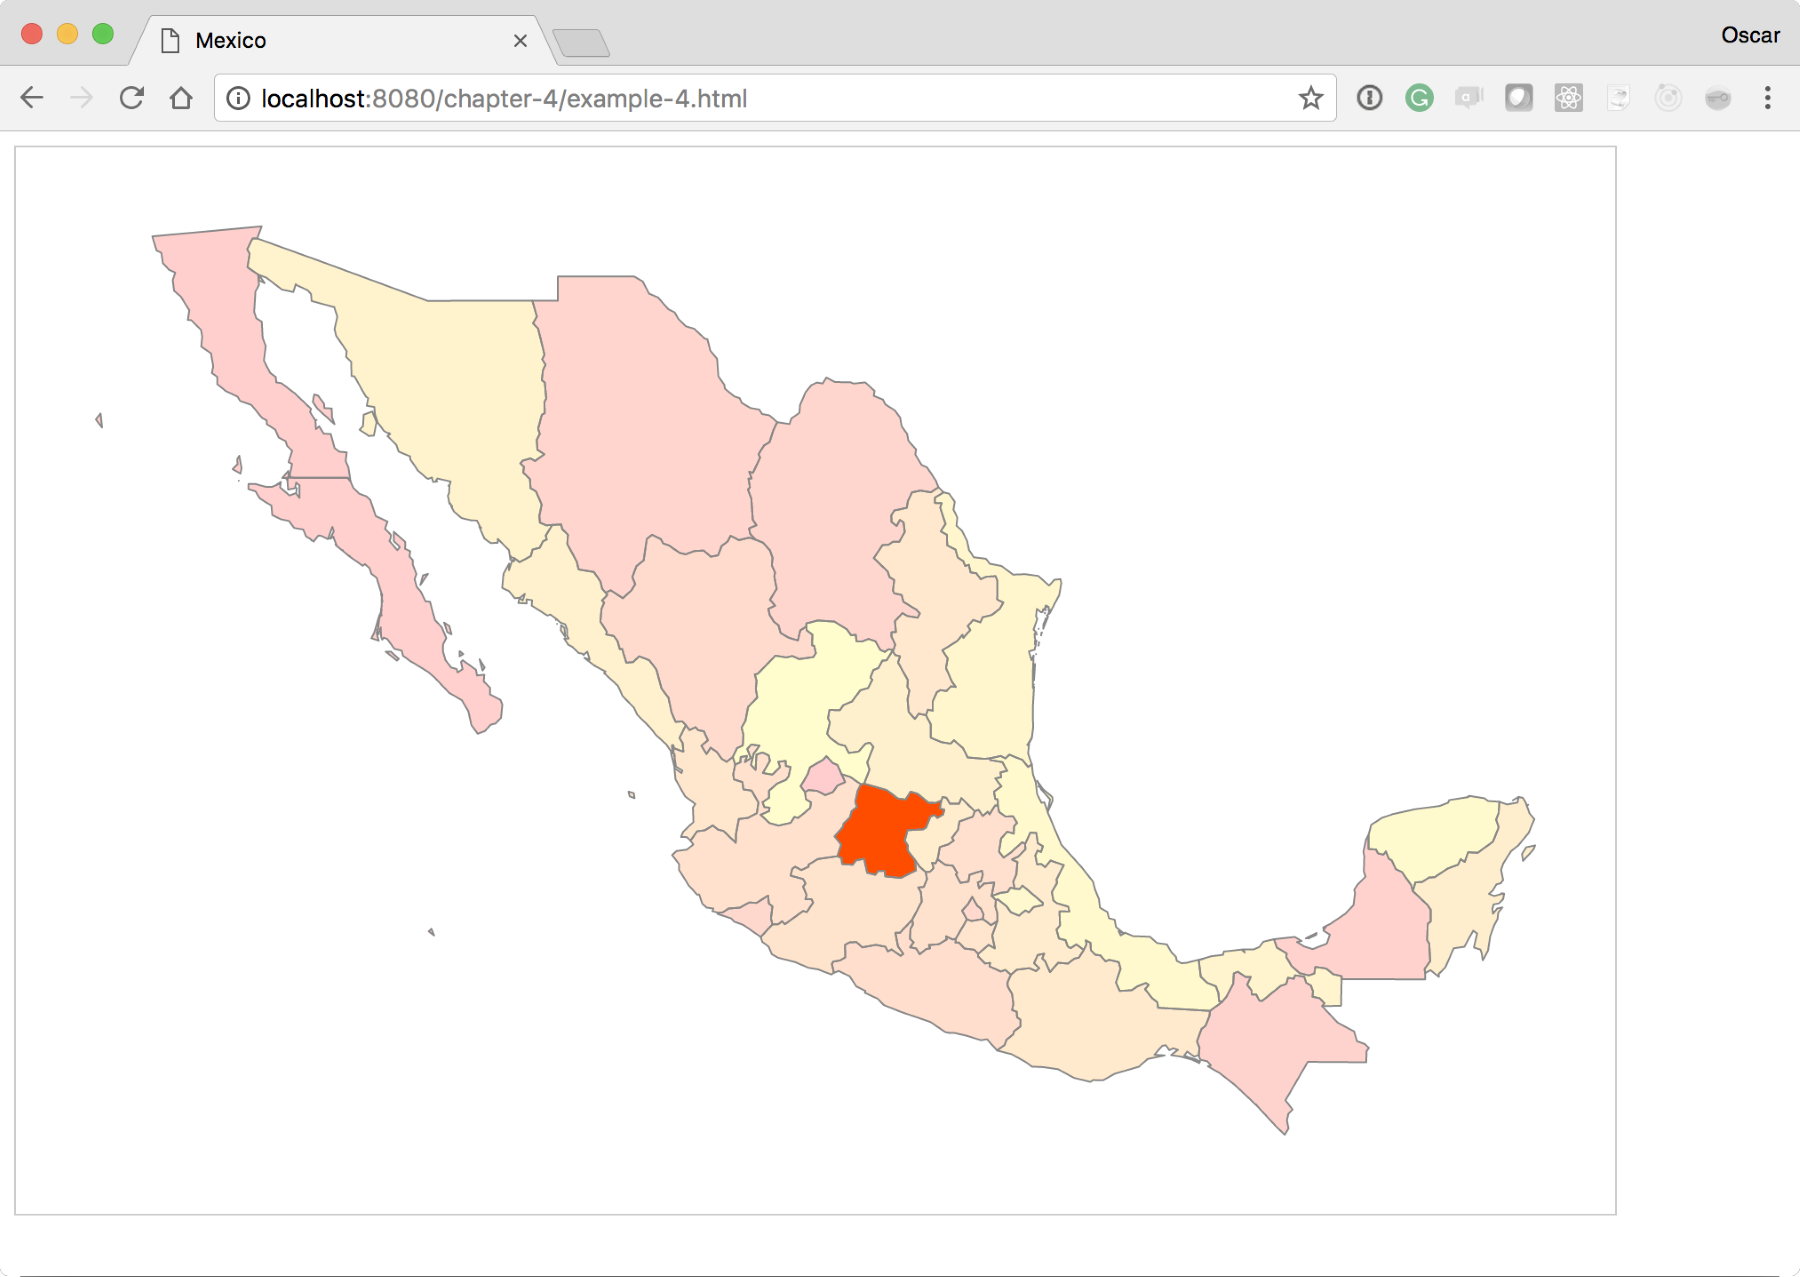
The code base should produce a map as follows. Check it out and make sure that you click on any of the states. You will see its color turn a little brighter than the surrounding states: