
After copying and pasting or scraping the data from Wikipedia, you should save your forest file in a data format of your choice. We saved it in CSV, and as we now have several data sources to load for one visual, we will use d3.queue() to wait for both files to load before invoking ready():
d3.queue()
  .defer(d3.json, 'data/world-110.json')
  .defer(d3.csv, 'data/forests.csv')
  .await(ready);
Then, adapt your ready() function arguments and start accordingly:
function ready(error, world, forests) {
  if (error) throw error;
Leave the country data prep as is (in that we push the world’s country arrays into a variable called countries) and move on to including the forest data into the world. What we want is this:
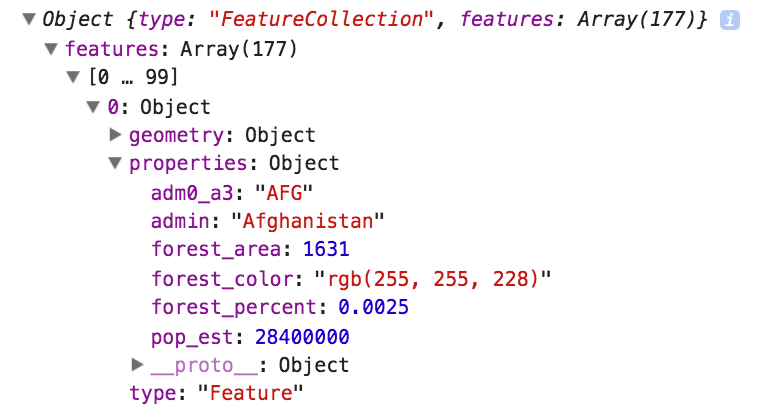
The properties we need for the coloring and the tooltip are country name (admin), forest_percent, and forest_area. Note, that we also have forest_color here. This is the choropleth color for that country. It’s often beneficial to have your data in place before the draw. Hefty calculations during redraw can slow down performance and re-render.
The forest CSV country names have been changed to match the exact naming of the countries GeoJSON. This way, you can use the names to join the two datasets. To join the data speedily, we will use binary search. Binary search leverages the sorted nature of our countries array to find a country match quickly. In short, it looks at the country name we want to find, and instead of looping through all countries in the GeoJSON, it splits the countries array in two halves and checks whether the search term is in the upper or the lower half. It does that repeatedly until it finds the term. This is much quicker than linear search (looping through all data); in our case, around 10 times faster.
You can implement binary search in D3 with d3.bisect() and that’s what we shall use. We add the data with a function we call insertForestDataBinary(). We shall add this function call and the function to the data preparation flow in the ready() function:
function insertForestDataBinary() {
  var bisectName = d3.bisector(function(d) { return d.properties.admin;
  }).right;
  for (var i = 0; i < forests.length; i++) {
    var indexBisect = bisectName(countries.features, forests[i].country);
    var indexMatch = indexBisect - 1;
    countries.features[indexMatch].properties.forest_area = +forests[i].area;
    countries.features[indexMatch].properties.forest_percent =
    +forests[i].percent;
    countries.features[indexMatch].properties.forest_color =
    colorScale(+forests[i].percent);
  }
 }
First, you create a bisector function so that D3 knows which variable we want to find a name (d.properties.admin, the country name). You then iterate through all forest objects. Each forest object holds the country (the name we match), forest_percent and forest_area properties. The bisector will search the array and return the index after the matching countries object (or to the .right, as we specified above). Once you have that, you can add the new properties one index position before.
For the last property, forest_color, you need to create a colorScale somewhere in higher scope:
var colorScale = d3.scaleSequential(d3.interpolateYlGn).domain([0,1]);