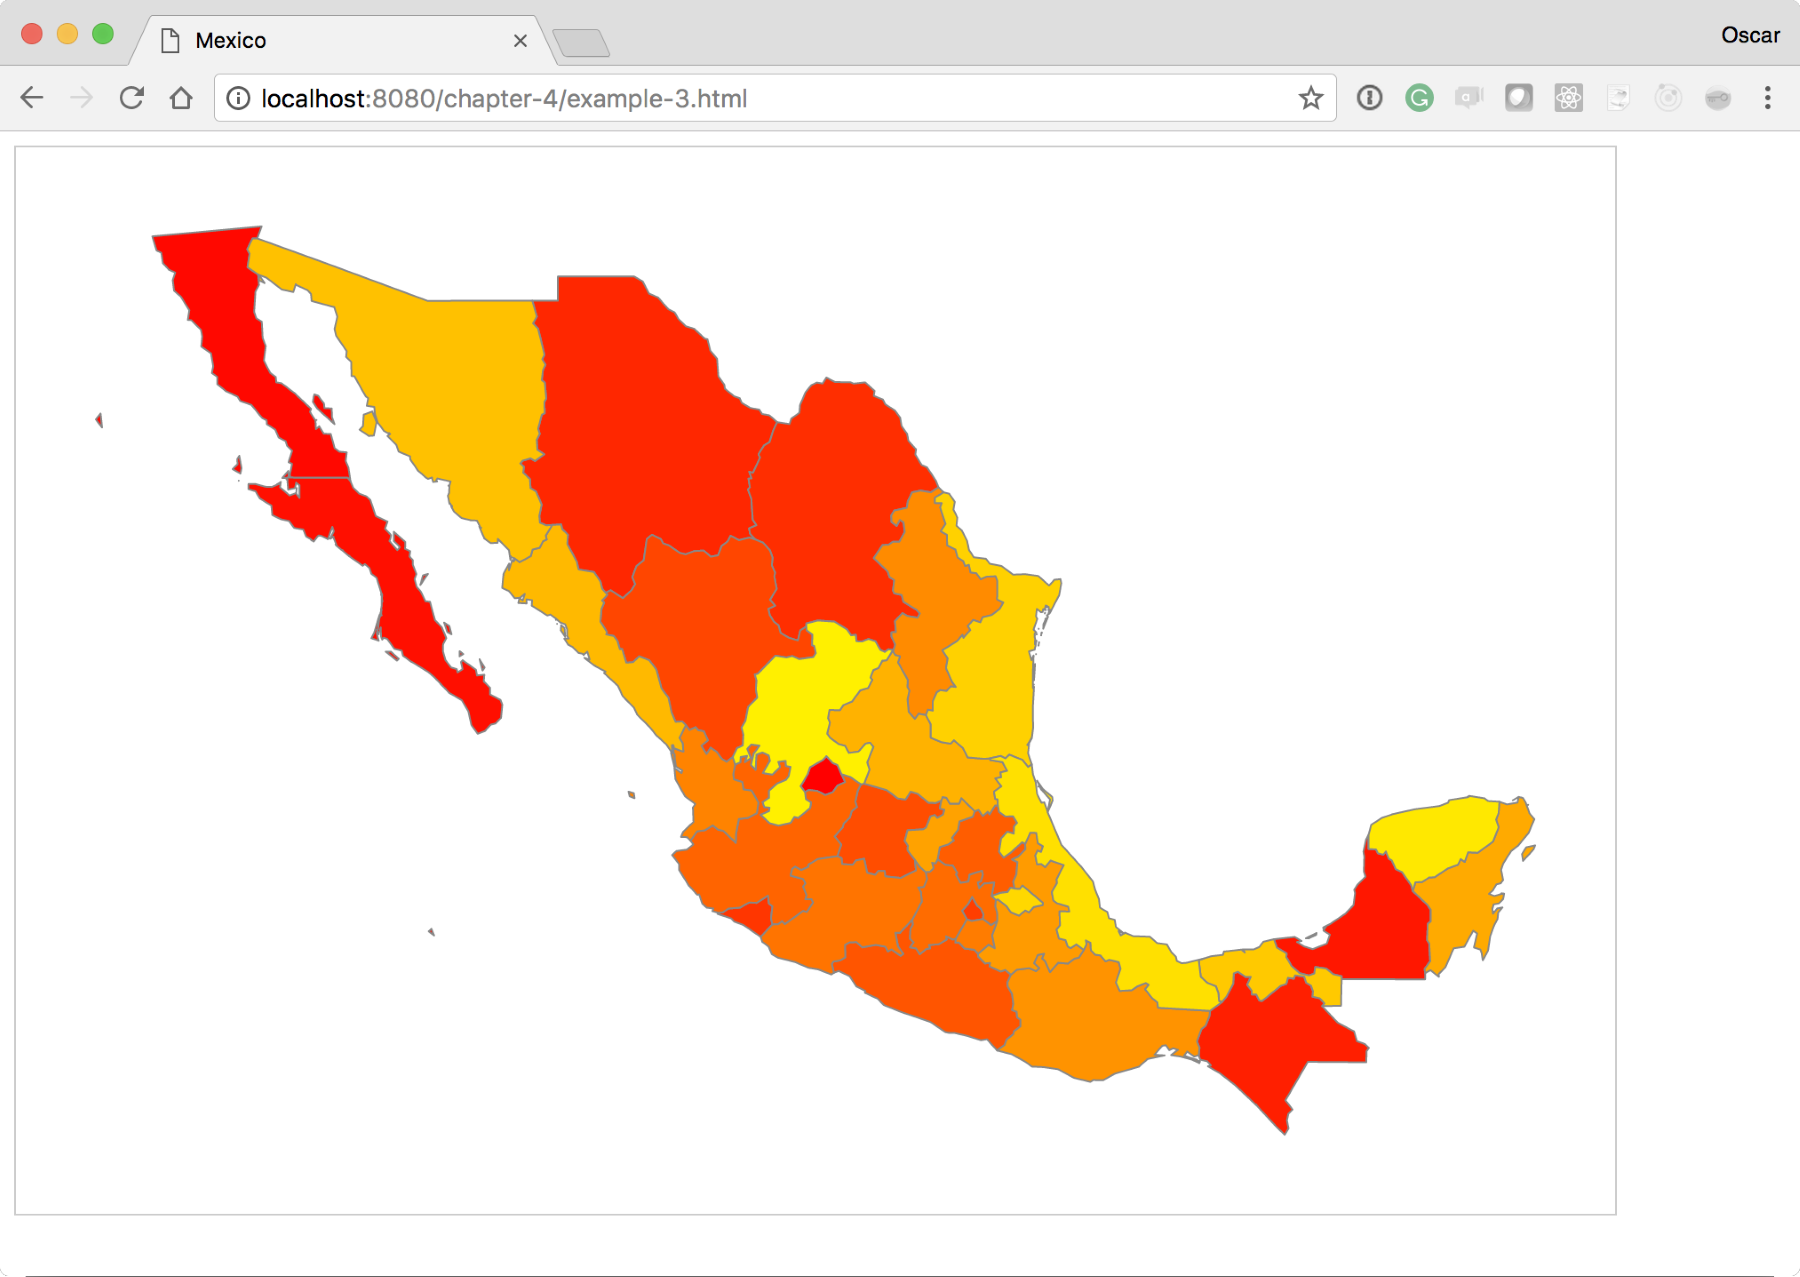
One of the most common uses of D3.js maps is to make choropleths. This visualization gives you the ability to discern between regions, giving them a different color. Normally, this color is associated with some other value, for instance, levels of influenza or a company's sales. The Choropleths are very easy to make in D3.js. In this experiment, we will create a quick choropleth based on the index value of the state in the array of all the states. Look at the following code, or use your browser and go here: http://localhost:8080/chapter-4/example-3.html.
We will only need to modify two lines of code in the Update section of our D3 code. Right after the enter() section, add the following two lines:
  //Update
  var color = d3.scaleLinear().domain([0,33]).range(['red',
   'yellow']);
  //Enter
  mexico.enter()
           .append('path')
           .attr('d', path)
           .attr('fill', function(d,i){
            return color(i);
           });
The color variable uses another valuable D3 function named scale. Scales are extremely powerful when creating visualizations in D3; much more detail on scales can be found at: https://github.com/d3/d3/blob/master/API.md#scales-d3-scale.
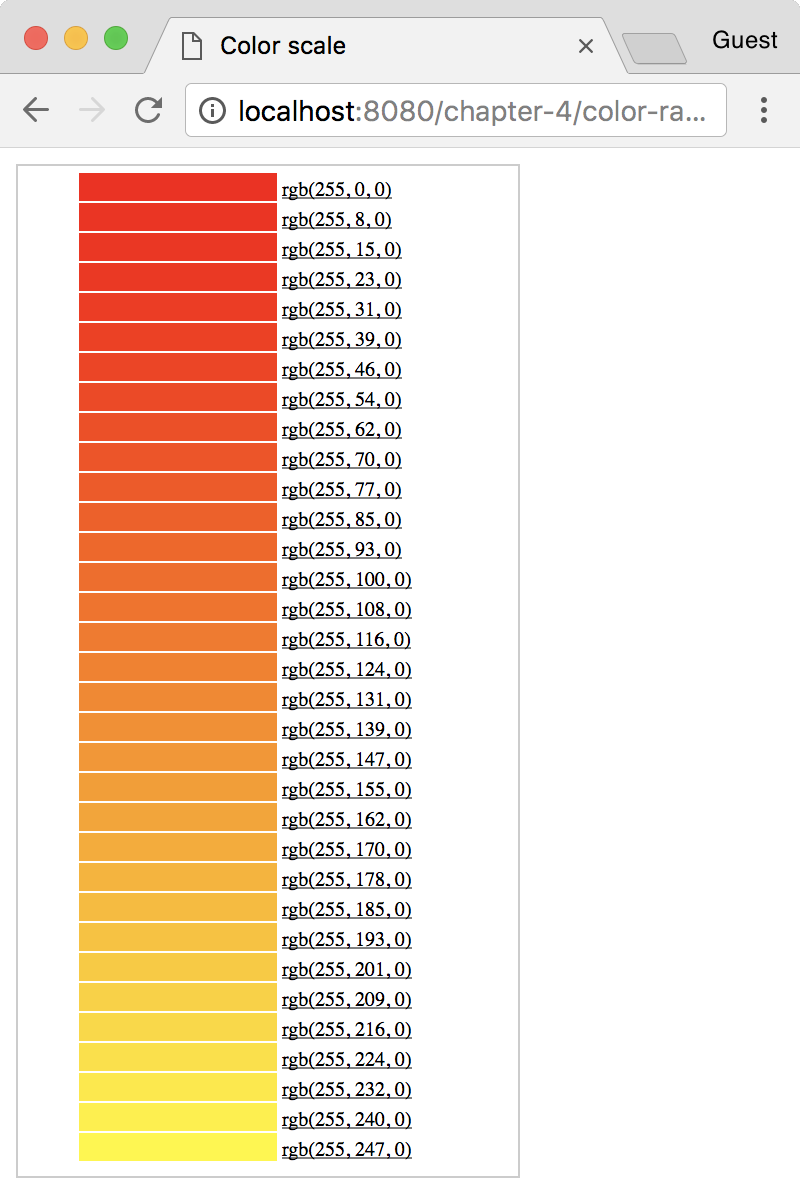
For now, let's describe what this scale defines. Here, we created a new function called color(). This color() function looks for any number between 0 and 33 in an input domain. D3 linearly maps these input values to a color between red and yellow in the output range. D3 has included the capability to automatically map colors in a linear range to a gradient. This means that executing the new function, color, with 0 will return the color red, color(15) will return an orange color, and color(33) will return yellow.
Here is a small table just for visual reference. It shows the color and its respective RGB value:
Now, in the update section, we will set the fill property of the path to the new color() function. This will provide a linear scale of colors and use the index value i to determine what color should be returned.
If the color was determined by a different value of the datum, for instance d.scales, then you would have a choropleth where the colors actually represent sales. The preceding code should render something as follows: