
You learned to build a data-driven and -giving representation of your visual. You have also used it to highlight the country at hover. However, you haven’t really tapped into the plentiful options of interaction this gives you. Let’s do this now. There’s a lot you could do, but I think a tooltip would be a reasonable place to start.
Before we embark on the tooltip build, let’s add some more interesting data to the globe. So far, we have country name, country name abbreviation, and population estimate. That’s already something to work with. However, let’s task ourselves with adding an additional data source to our globe, visualize it appropriately, and add a sensible interaction for user exploration.
As a little reminder, this is what you will build:
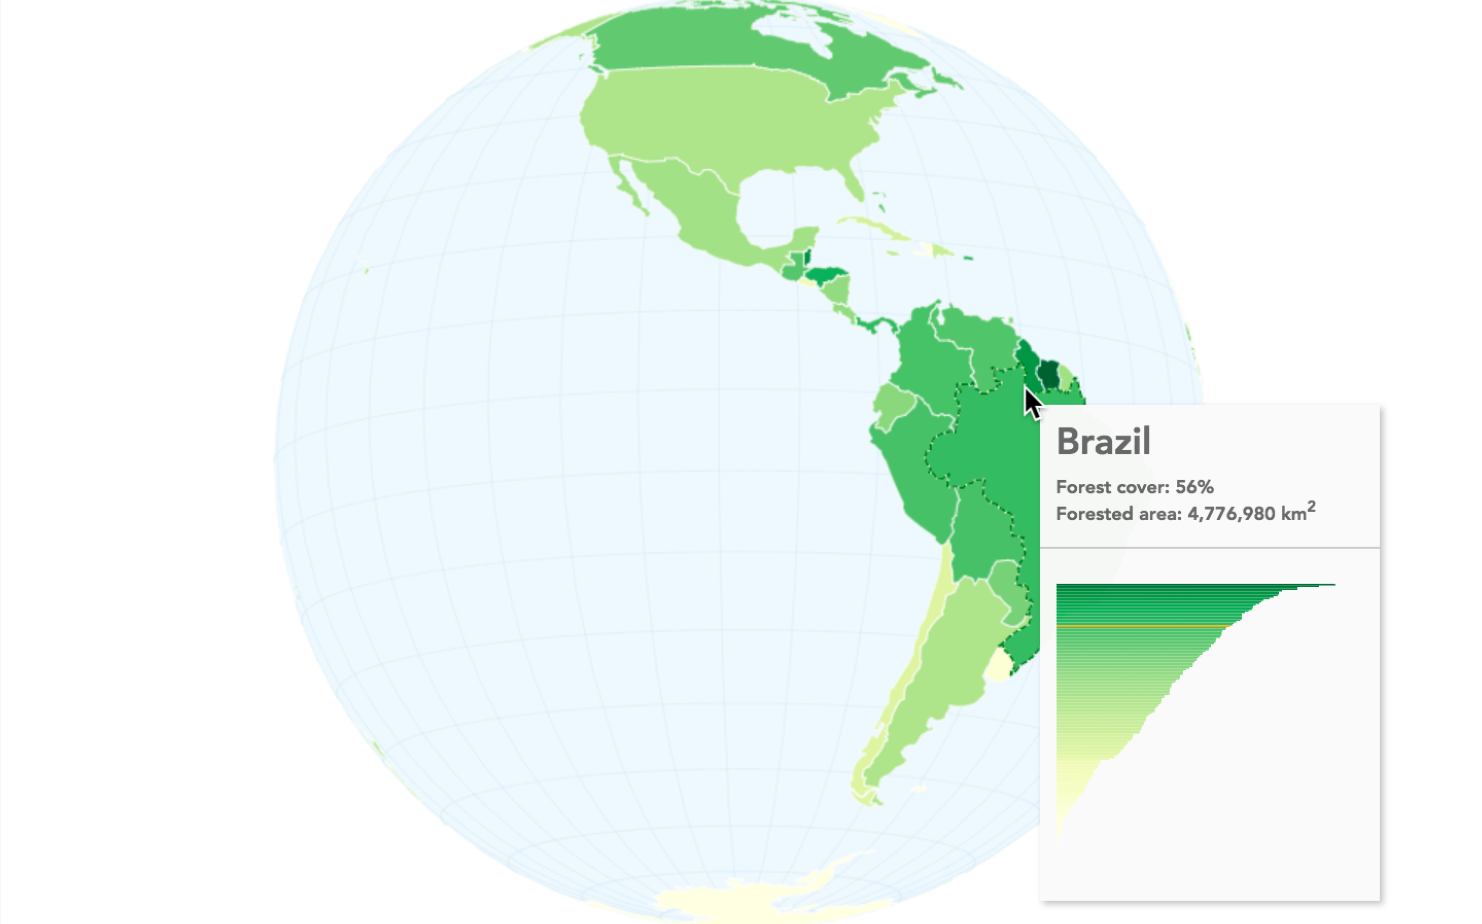
The preceding screenshot shows a globe visualization of forest cover per country. The data comes from the source of all solid wisdom, Wikipedia. The suggestion is to visualize it as a choropleth map. Arguably, choropleth maps have been overused in recent years, but they are nonetheless a great option to show percentage comparisons of geo-areas.
The steps are relatively simple. First, we add our forest data to our GeoJSON world object. We’ll move on swiftly to color our countries according to the new data, and finally add a tooltip with HTML and SVG.