Our previous example was very fascinating. We went from visualizing a map in two dimensions to three dimensions with just a few lines. The next step is to animate it. For this experiment, open http://localhost:8080/chapter-5/example-5.html in the code samples. Let's now piece it together:
var i = 0;
We added an index variable that will hold the rotation rate. Don't worry; we'll explain how this is used here:
d3.json('world.json', function(data) {
var countries = topojson.feature(data, data.objects.countries);
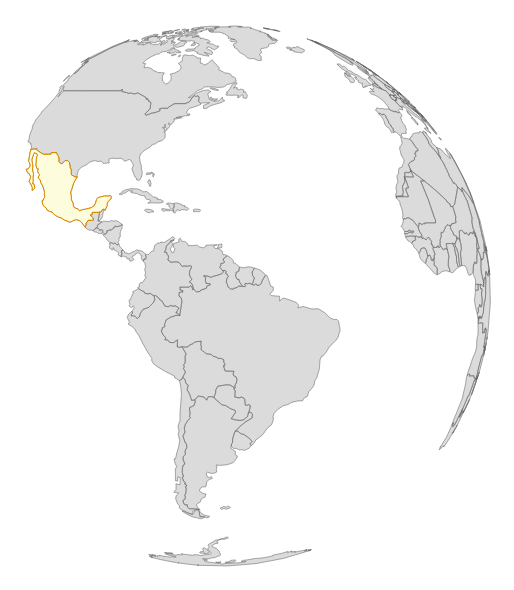
var mexico = countries.features[102];
As Mexico is the center of the universe and requires special attention, we isolated it into its own variable by taking the corresponding feature from the countries' feature array. This will allow us to manipulate it separately from the rest of the globe:
var map = svg.append('g').attr('class', 'boundary');
var world = map.selectAll('path').data(countries.features);
var mexico = map.selectAll('.mexico').data([mexico]);
Next, we will data join the information we isolated earlier to its own variable. This way, we will have one map that represents the entire world and another one that represents just Mexico:
mexico.enter()
  .append('path')
  .attr('class', 'mexico')
  .attr('d', path)
  .style('fill', 'lightyellow').style('stroke', 'orange');
We will inject the map of Mexico and apply the geo.path that contains the same projection we used for the world map. We will also add a light yellow background to Mexico using the fill CSS style and an orange border using the stroke:
setInterval(function() {
i = i+0.2;
      // move i around in the array to get a feel for yaw, pitch
      // and roll
      // see diagram
projection.rotate([i,0,0])
world.attr('d', path);
mexico.attr('d', path)
   .style('fill', 'lightyellow').style('stroke', 'orange');
    }, 20);
This is where the action starts, literally. We created an interval that executes every 20 milliseconds. This interval contains a function that utilizes our index variable and increments the value by 0.2. This value is then applied to the rotate function of our projection. Specifically, we will adjust the rotation every 20 ms on this line of code:
projection.rotate([i,0,0])
Yaw is represented by the first value of the array (in this case, i), pitch represented by the second value, and roll by the third value. Yaw, pitch, and roll are rotation angles and are applied in their respective vectors. The following image provides an illustration of how the angles rotate:
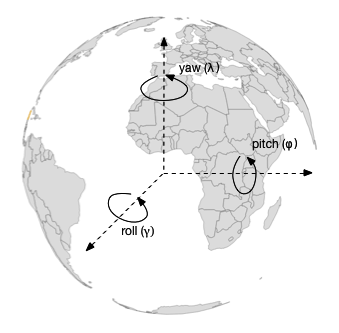
Here, we see that the yaw vector points in the z direction and is around the center axis. The pitch goes along our x axis, and the yaw goes around our y axis. The Greek characters (in parentheses in the preceding image) are often used to depict yaw, pitch, and roll.
In our case, the index variable, i, is increasing and is allocated to the yaw rotation. This means that our globe will spin from left to right around the center axis. If we were to swap the position of our index so that it is in the pitch location (the second array element), our globe would spin vertically:
project.rotate([0,i,0]);
Finally, we will use the same D3 update pattern and update all the paths with the new projection. Give it a shot, play around with the example, and see how the globe spins in different directions. When complete, you will see the rotating globe in your browser, as in the following screenshot: