
Note that you have implemented all these changes before you draw the globe. That’s great as you can now simply draw it with the new color scheme. The only change is in our drawScene() function, filling the countries accordingly in a loop:
function drawScene(countries, countryIndex) {
  // Clear the rect, draw the sphere and the graticule
  // Country fill - individual

  countries.features.forEach(function(el) {
    bufferContext.beginPath();
    bufferPath(el);
    bufferContext.fillStyle = el.properties.forest_color;
    bufferContext.fill();
  });

  // Draw the country stroke…
}
Also, note that we adjusted the sphere fill and the graticule colors a little to work better with our yellow-green country color scale:
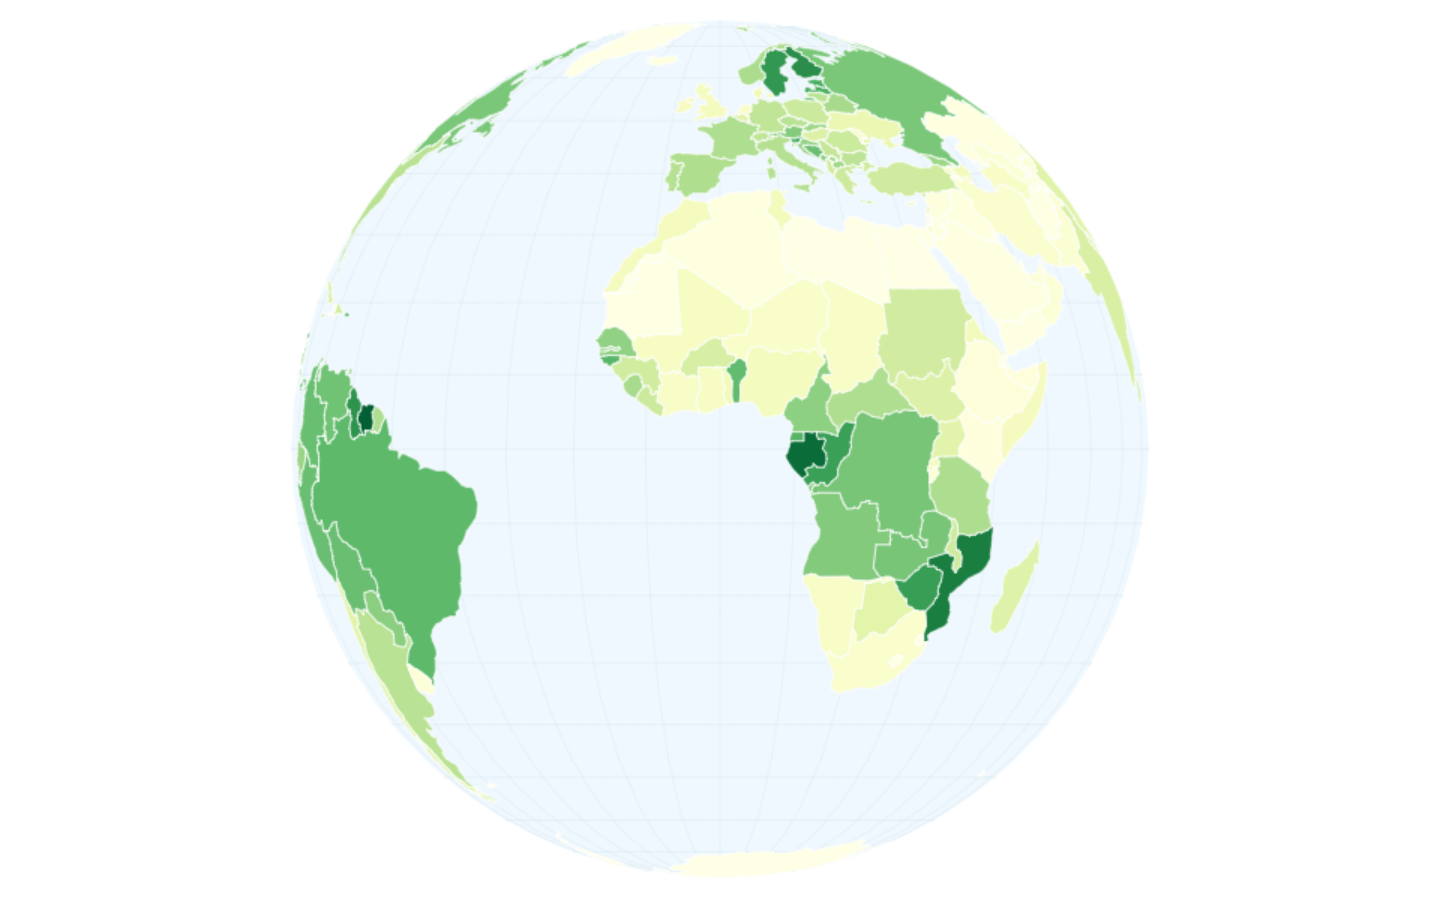
A choropleth globe visualizing forest cover ratio per country