TopoJSON is another JSON-based format that encodes geographic data. If you remember, GeoJSON describes geographic data discretely. This means GeoJSON borders can be described twice. The TopoJSON format removes this duplicate behavior, often creating files that are 80 percent smaller. This format is extremely helpful when building for the web, where data transfer size plays an important role.
The term TopoJSON can be confusing. Let's break it down into its three dimensions:
- TopoJSON, the serialized format: The actual serialized JSON format that describes how to draw geographic shapes.
- topojson, the command-line utility: This is a program that a user can run to create TopoJSON files from shapefiles. The utility contains many levers to further reduce the size of the file.
- topojson.js, the JavaScript library: The library used in your D3 map to convert the TopoJSON-serialized format back to GeoJSON, so that the d3.geo.path functions work correctly.
To illustrate to what extent TopoJSON can reduce the file size, let's execute the command-line utility against the shapefiles we downloaded earlier. Open the command line and execute the following in the same directory where you downloaded and unzipped the ESP_adm.zip file:
topojson -o spain-topo.json -p -- ESP_adm0.shp
This command creates a new TopoJSON-formatted file named spain-topo.json
and preserves all the data properties (the -p flag) from the ESP_adm0 shapefile
(note that the shapefile needs to come after the -- in the command-line syntax).
The -o parameter defines the name of the resulting TopoJSON file.
First, let's compare file sizes with GeoJSON versus TopoJSON for the exact same geographic region:
- GeoJSON: 6.4 MB
- TopoJSON: 379 KB
This is an incredible compression rate, and we just used the defaults!
In order to incorporate TopoJSON into our map, we need to use the topojson.js JavaScript library and alter a few lines of code. We will start with example-1.html. The final version can be viewed in example-2.html (http://localhost:8080/chapter-6/example-2.html):
<script src="http://d3js.org/topojson.v1.min.js"></script>
First, we add the JavaScript library as a <script> tag to our file. Now you know why we have been using this library all along:
d3.json('topojson/spain-topo.json', function(data) {
Next, we inject our topojson file that we just created via AJAX:
var country = topojson.feature(data, data.objects.ESP_adm0);
We add an additional line of code to convert the TopoJSON format to the GeoJSON feature format:
var b = path.bounds(country);
We need to remember to create our bounding box using the interpolated features:
spain = map.selectAll('path').data(country.features);
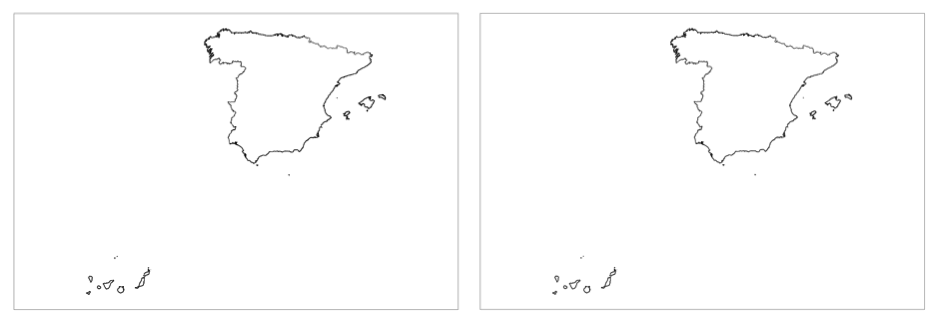
Now, we use the data join on our new data. As expected, we will see our map of Spain. Let's show them side by side in the following screenshot to compare GeoJSON and TopoJSON (with GeoJSON on the left and TopoJSON on the right):