
According to the three element categories we want to represent, we need three data sources to build the visual. The map data, data about airport locations, as well as flight data, showing origins and destinations for each flight. We will call this the route data. Both datasets come from openflights.org which offers a tool you can use to map flights as well as databases for flights worldwide including routes and airport location data. This is exactly what we're after.
After light cleaning and minor modifications, the first 10 entries of the route data and the airport location data with 100 flights look as follows:
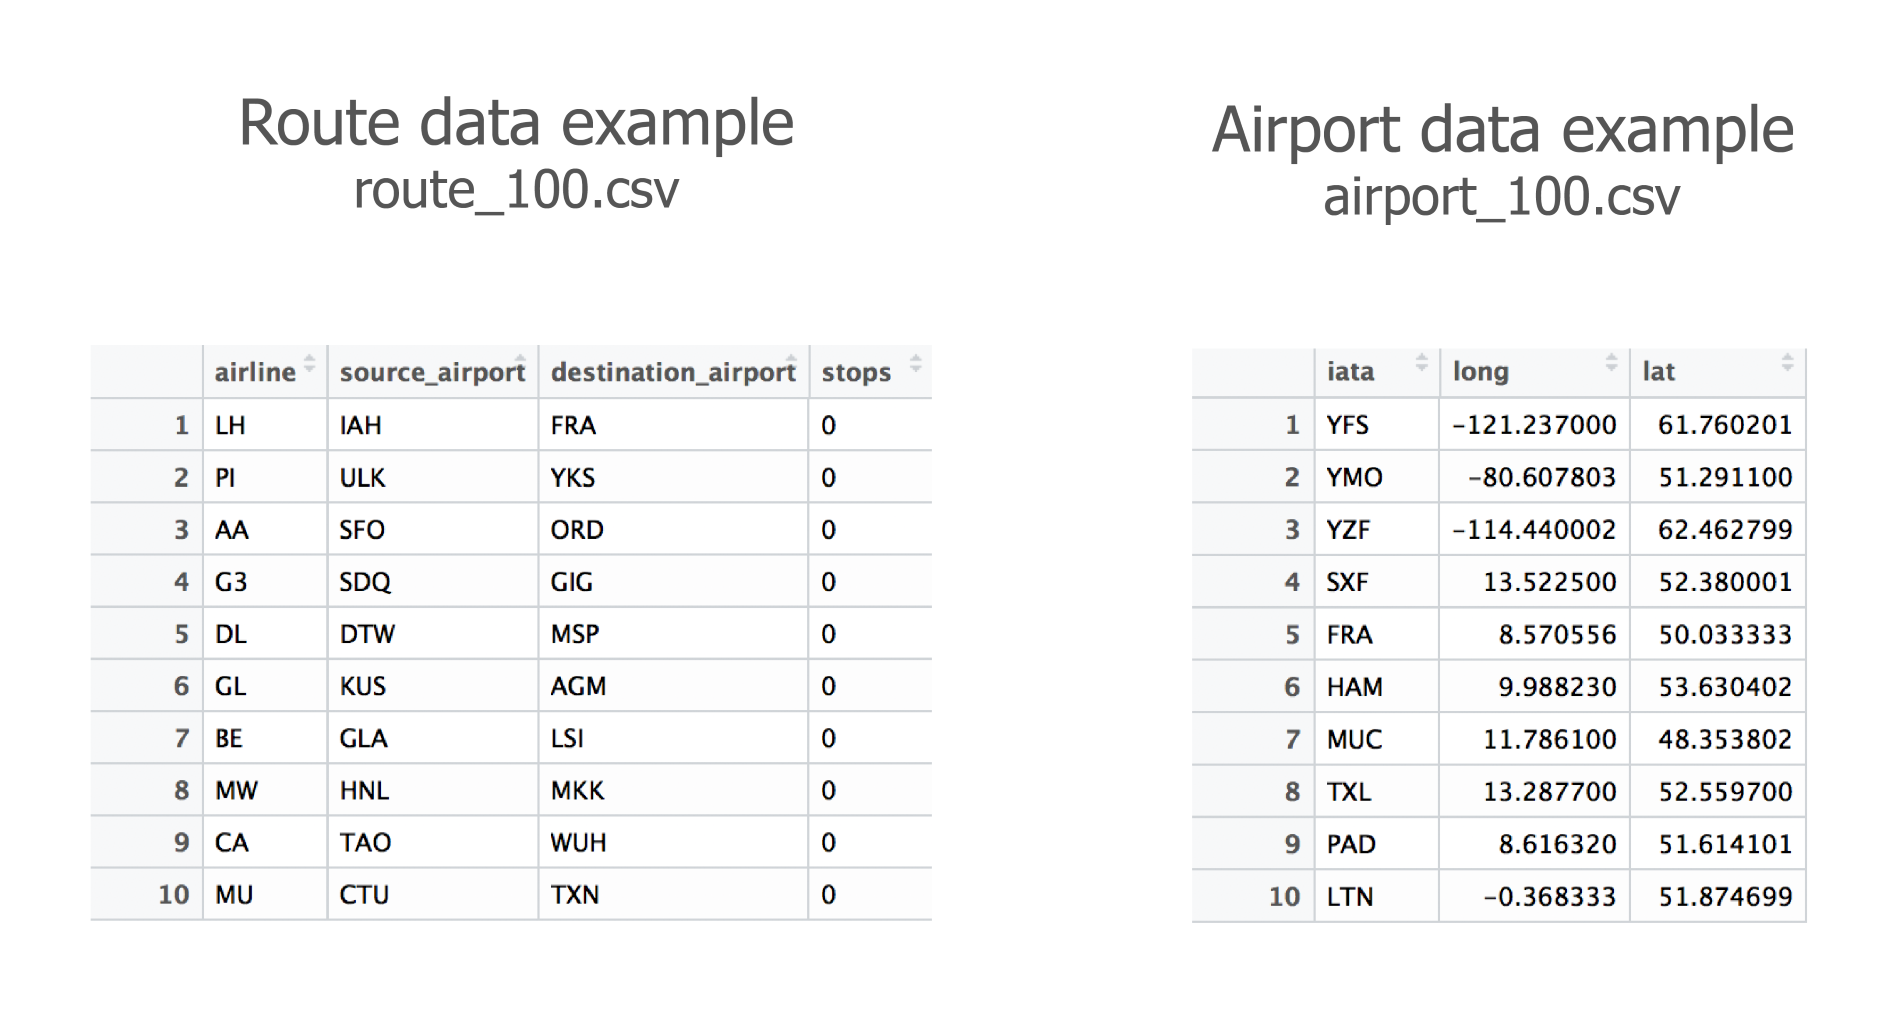
All variable names are self-explanatory. Note that the first variable in the airport data, iata, represents the official three-letter airport code from the International Air Transport Association (IATA). Also note that we had to remove some flights per dataset as not every airport location was available, which in fact leads to a lower number (less than 2-3%) of flights than the buttons suggest.