
As mentioned fleetingly previously, d3.hexbin() has two heads. Its first use is as a D3 layout function such as the force-layout, the tree-layout, or the circle-pack-layout functions D3 offers. Data in, augmented data out. We pass our data and the desired hexagon radius to it, and, for each set of data points it can wrap its shape around, it will return the center coordinate of that hexagon.
If we only gave it one data point, it would return one hexagon. If we gave it two data points close together so it fits into the hexagon’s width and height defined by the radius, it would also just return a single hexagon. If the second data point were far off the first one so that the hexagon couldn’t cover it with the given radius, d3.hexbin() would produce a second hexagon, embracing that second point.
Here we use its layouting powers:
function getHexPoints(points) {
  hexbin = d3.hexbin() // note: global
    .radius(hexRadius)
    .x(function(d) { return d.x; })
    .y(function(d) { return d.y; });

  var hexPoints = hexbin(points);
    return hexPoints;
}
First, we configure the layout. We add our radius of 3.5 (the Distance of 5.25 / 1.5) to it and guide its attention to where it can find the x and y coordinates. In the next row, we use it on our grid points and return the resulting array of objects that looks as follows:
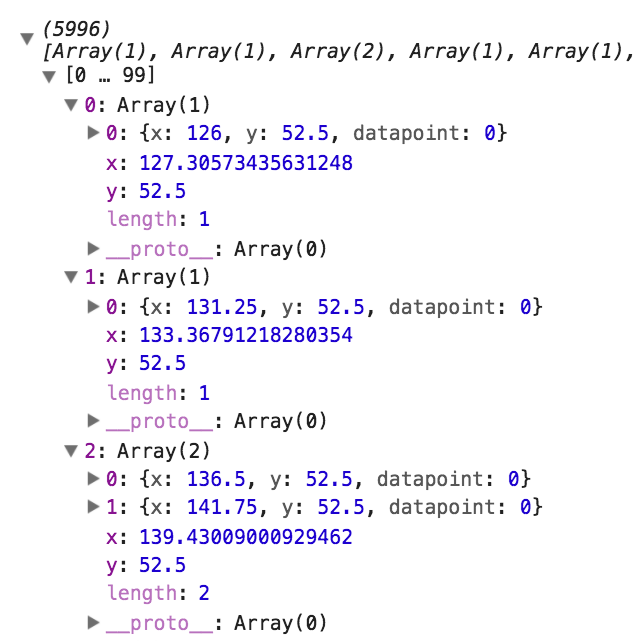
Our grid points are represented by 5,996 hexagonal center points, which we will just call hex points from now on. Let’s briefly go through this. The hexbin layout returns an array. Each element represents a single hexagon. In each element, each object represents a point the hexagon covers. Additionally, d3.hexbin() adds two keys to the array: x and y. Their values represent the hexagon’s center. So, for each hexagon, we have all point data as well as the hexagon’s center coordinates.
As you can see in the preceding screenshot, the first two hexagons cover only one grid point, whereas the third covers two grid points. You can also see how the center points in the array keys are slightly different from the layout points in the objects. Let’s visualize it.