
So, how are we doing this? As established many times above, we can’t just add a listener to a set of pixels, because an event is an object maintained by the browser, interacting with DOM nodes. However, our browser doesn’t know about the pixel. It doesn’t have a representation of the Canvas pixels it wants to interact with. So, how?
The answer is relatively simple: we build it ourselves. Not the DOM, that would be madness, but a representation of our Canvas drawing in which the target object’s pixel are charged with this object’s information.
So, what do we need to build our own little visual object representation? In short, you will build two Canvases. One main Canvas that produces our visual (done already) and one hidden Canvas (as in you can’t see it) that produces the same visual. The key here is that all elements on the second Canvas will be at the same position in relation to the Canvas origin compared to the first Canvas. We will bend this rule a little in practice, but, for now, imagine that the northern tip of Scotland is at pixel position 250, 100 of the main Canvas and that it is also at 250, 100 of the hidden Canvas.
There is only one key difference between the main and the hidden Canvas. Each element on the hidden Canvas will get a unique color. What’s more, these color values will be indexes to look up our data values. In our case, we will assign rgb(0,0,0) to the first country in our country list: Afghanistan. Our second country will get the color value rgb(1,0,0) and so on until our last country–Zimbabwe–will get the color value rgb(176,0,0).
Why? Because, next, we will attach a mousemove listener to the main Canvas to retrieve a flow of mouse positions as we move the mouse. At each mouse position, we can use the Canvas's own method context.getImageData() to pick the color of the pixel at this exact position. We just extract the R value from our RGB color and can query our data array to get the object we need.
Our itinerary is clear and, with three steps, relatively short. First, we will create the hidden Canvas. Secondly, we will draw the world with a unique color per country. Finally, we will write the mousemove handler to pick the color and get the data. Lastly, we have to decide what to do with all that data we can access.
Before we start, let’s make sure that we actually have some data for each country. Here’s our GeoJSON country object that shows the contents of the first two of 177 countries:
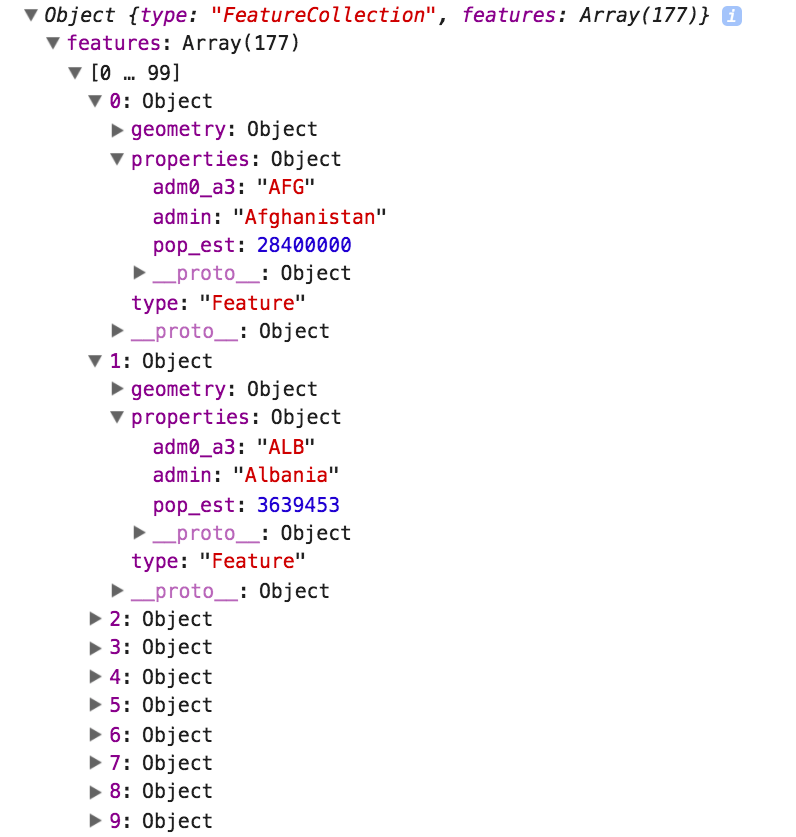
Our GeoJSON world is a FeatureCollection with one feature per country, ascendingly sorted by country name. Each feature is an object holding a type property, the geometry for the country polygon, and a property called properties. In here, we have three data points: the country abbreviation, the country name, and even an estimate of the country’s population. Now, let’s get to that data by mouse over.