
What do we want to achieve? There are two major steps we want to cover. First, we want to show the US as a hexagon tiling. Next, we want to highlight hexagons with farmers' markets, color encoding the number of markets within each hexagon.
Alternatively, we could be content with showing a map of the US and only display the hexagons where farmers' markets reside. This would be less involved; however, it seems worthwhile to go the extra mile for esthetics and clarity.
The actual drawing of the hexbin is simple, thanks to the d3.hexbin() module doing the hardwork of drawing the hexagons. More attention will be required when producing the hexagonal grid of the US. However, don’t worry; the process is straightforward and right here:
- Draw a map.
- Overlay the entire map with a symmetric grid of points.
- Only keep the grid points that are within the bounds of the map.
- Merge the grid points data with the location data we want to visualize.
- Calculate the hexbin positions with the D3-hexbin module.
- For each hexagon, aggregate the summary statistic you want to visualize.
- Visualize the summary statistic (for example, by color encoding the hexagons):
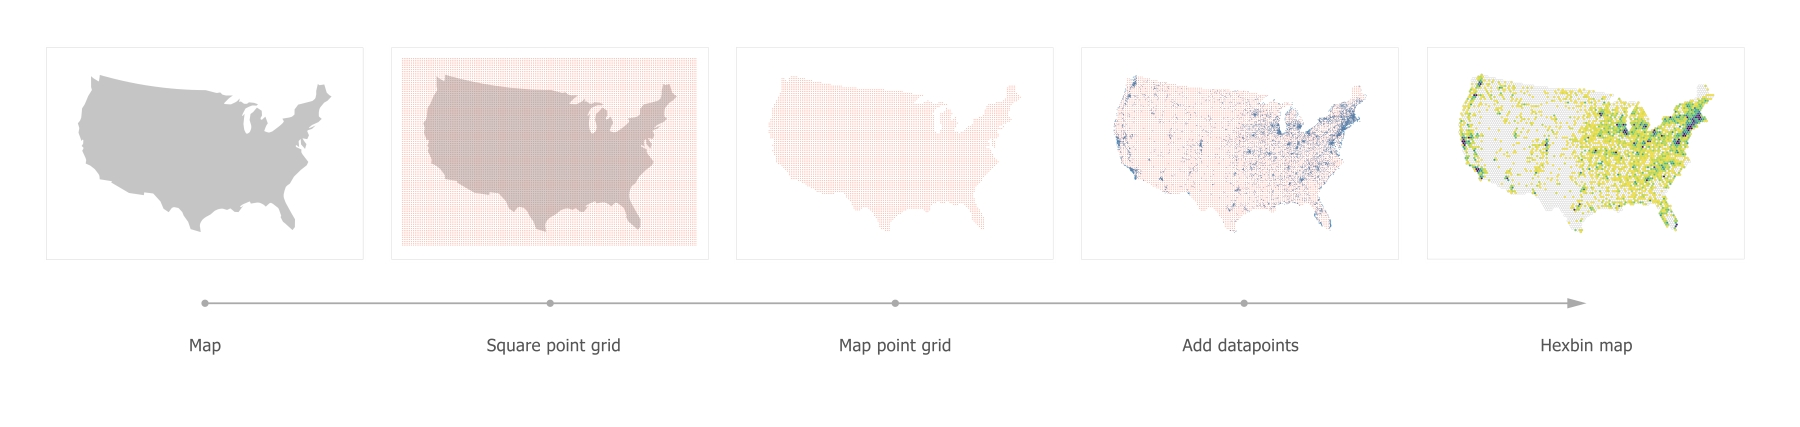
The hexbin map evolution