Table of Contents for
QGIS: Becoming a GIS Power User
 QGIS: Becoming a GIS Power User
Published by
Packt Publishing, 2017
QGIS: Becoming a GIS Power User
Published by
Packt Publishing, 2017
- Cover
- Table of Contents
- QGIS: Becoming a GIS Power User
- QGIS: Becoming a GIS Power User
- QGIS: Becoming a GIS Power User
- Credits
- Preface
- What you need for this learning path
- Who this learning path is for
- Reader feedback
- Customer support
- 1. Module 1
- 1. Getting Started with QGIS
- Running QGIS for the first time
- Introducing the QGIS user interface
- Finding help and reporting issues
- Summary
- 2. Viewing Spatial Data
- Dealing with coordinate reference systems
- Loading raster files
- Loading data from databases
- Loading data from OGC web services
- Styling raster layers
- Styling vector layers
- Loading background maps
- Dealing with project files
- Summary
- 3. Data Creation and Editing
- Working with feature selection tools
- Editing vector geometries
- Using measuring tools
- Editing attributes
- Reprojecting and converting vector and raster data
- Joining tabular data
- Using temporary scratch layers
- Checking for topological errors and fixing them
- Adding data to spatial databases
- Summary
- 4. Spatial Analysis
- Combining raster and vector data
- Vector and raster analysis with Processing
- Leveraging the power of spatial databases
- Summary
- 5. Creating Great Maps
- Labeling
- Designing print maps
- Presenting your maps online
- Summary
- 6. Extending QGIS with Python
- Getting to know the Python Console
- Creating custom geoprocessing scripts using Python
- Developing your first plugin
- Summary
- 2. Module 2
- 1. Exploring Places – from Concept to Interface
- Acquiring data for geospatial applications
- Visualizing GIS data
- The basemap
- Summary
- 2. Identifying the Best Places
- Raster analysis
- Publishing the results as a web application
- Summary
- 3. Discovering Physical Relationships
- Spatial join for a performant operational layer interaction
- The CartoDB platform
- Leaflet and an external API: CartoDB SQL
- Summary
- 4. Finding the Best Way to Get There
- OpenStreetMap data for topology
- Database importing and topological relationships
- Creating the travel time isochron polygons
- Generating the shortest paths for all students
- Web applications – creating safe corridors
- Summary
- 5. Demonstrating Change
- TopoJSON
- The D3 data visualization library
- Summary
- 6. Estimating Unknown Values
- Interpolated model values
- A dynamic web application – OpenLayers AJAX with Python and SpatiaLite
- Summary
- 7. Mapping for Enterprises and Communities
- The cartographic rendering of geospatial data – MBTiles and UTFGrid
- Interacting with Mapbox services
- Putting it all together
- Going further – local MBTiles hosting with TileStream
- Summary
- 3. Module 3
- 1. Data Input and Output
- Finding geospatial data on your computer
- Describing data sources
- Importing data from text files
- Importing KML/KMZ files
- Importing DXF/DWG files
- Opening a NetCDF file
- Saving a vector layer
- Saving a raster layer
- Reprojecting a layer
- Batch format conversion
- Batch reprojection
- Loading vector layers into SpatiaLite
- Loading vector layers into PostGIS
- 2. Data Management
- Joining layer data
- Cleaning up the attribute table
- Configuring relations
- Joining tables in databases
- Creating views in SpatiaLite
- Creating views in PostGIS
- Creating spatial indexes
- Georeferencing rasters
- Georeferencing vector layers
- Creating raster overviews (pyramids)
- Building virtual rasters (catalogs)
- 3. Common Data Preprocessing Steps
- Converting points to lines to polygons and back – QGIS
- Converting points to lines to polygons and back – SpatiaLite
- Converting points to lines to polygons and back – PostGIS
- Cropping rasters
- Clipping vectors
- Extracting vectors
- Converting rasters to vectors
- Converting vectors to rasters
- Building DateTime strings
- Geotagging photos
- 4. Data Exploration
- Listing unique values in a column
- Exploring numeric value distribution in a column
- Exploring spatiotemporal vector data using Time Manager
- Creating animations using Time Manager
- Designing time-dependent styles
- Loading BaseMaps with the QuickMapServices plugin
- Loading BaseMaps with the OpenLayers plugin
- Viewing geotagged photos
- 5. Classic Vector Analysis
- Selecting optimum sites
- Dasymetric mapping
- Calculating regional statistics
- Estimating density heatmaps
- Estimating values based on samples
- 6. Network Analysis
- Creating a simple routing network
- Calculating the shortest paths using the Road graph plugin
- Routing with one-way streets in the Road graph plugin
- Calculating the shortest paths with the QGIS network analysis library
- Routing point sequences
- Automating multiple route computation using batch processing
- Matching points to the nearest line
- Creating a routing network for pgRouting
- Visualizing the pgRouting results in QGIS
- Using the pgRoutingLayer plugin for convenience
- Getting network data from the OSM
- 7. Raster Analysis I
- Using the raster calculator
- Preparing elevation data
- Calculating a slope
- Calculating a hillshade layer
- Analyzing hydrology
- Calculating a topographic index
- Automating analysis tasks using the graphical modeler
- 8. Raster Analysis II
- Calculating NDVI
- Handling null values
- Setting extents with masks
- Sampling a raster layer
- Visualizing multispectral layers
- Modifying and reclassifying values in raster layers
- Performing supervised classification of raster layers
- 9. QGIS and the Web
- Using web services
- Using WFS and WFS-T
- Searching CSW
- Using WMS and WMS Tiles
- Using WCS
- Using GDAL
- Serving web maps with the QGIS server
- Scale-dependent rendering
- Hooking up web clients
- Managing GeoServer from QGIS
- 10. Cartography Tips
- Using Rule Based Rendering
- Handling transparencies
- Understanding the feature and layer blending modes
- Saving and loading styles
- Configuring data-defined labels
- Creating custom SVG graphics
- Making pretty graticules in any projection
- Making useful graticules in printed maps
- Creating a map series using Atlas
- 11. Extending QGIS
- Defining custom projections
- Working near the dateline
- Working offline
- Using the QspatiaLite plugin
- Adding plugins with Python dependencies
- Using the Python console
- Writing Processing algorithms
- Writing QGIS plugins
- Using external tools
- 12. Up and Coming
- Preparing LiDAR data
- Opening File Geodatabases with the OpenFileGDB driver
- Using Geopackages
- The PostGIS Topology Editor plugin
- The Topology Checker plugin
- GRASS Topology tools
- Hunting for bugs
- Reporting bugs
- Bibliography
- Index
While QGIS developers do their best to make every QGIS release as stable as possible, sometimes you may encounter bugs or even crashes. To get them fixed in the future, it is necessary to inform the developers about issues.
This recipe shows you how to perform basic debugging and collect information that will help developers understand the problem better and help to fix it.
As the QGIS development process is very quick, bugs that are present in older versions are very likely already fixed in the latest version. So, it is necessary to ensure that you have the most recent QGIS version. If you use the development version of QGIS (so called "nightly" builds), upgrade to the last available build. If you prefer stable releases, then ensure that you have the latest stable version.
- Repeat the same actions again using the same data and settings to ensure that this is not an accidental error.
- Test your vector data (if any) with geometry checking tools to ensure that data is valid and has no geometry errors. If the data has geometry errors, then try to reproduce the bug with valid data.
- Check whether the same error happens with other data to ensure that this is not related to the specific dataset.
- If the error happens only on some specific features, extract them into a separate layer and make a small self-containing test dataset that allows you to reproduce bug. The same approach should be used if the dataset is large.
- Sometimes, errors may be caused by third-party plugins. Disable all plugins and try to reproduce the error. If you cannot reproduce the bug with the disabled plugins, probably this bug is somehow related to some plugin. To find this problematic plugin, activate the plugins one by one and try to reproduce the error.
- Look in the QGIS message log, it may contain useful debug and/or error messages that are related to your problem:
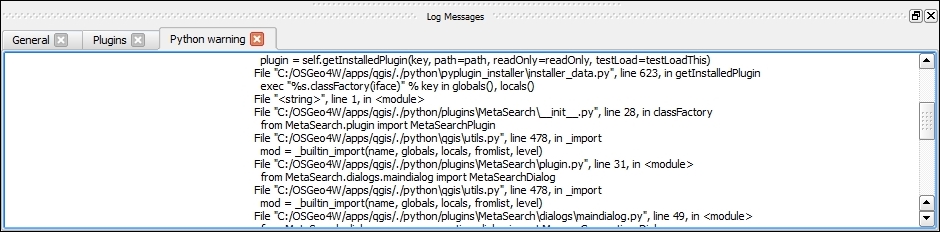
- To open the Log Messages window, click on the Messages button located in the right corner of the QGIS status bar.
- If QGIS crashes, try to create a backtrace and/or collect debug messages (refer to the following sections). This will be extremely useful if your bug is not reproducible on the developer's computer.
Under Linux, QGIS automatically tries to use gdb to produce a backtrace when crashed.
If you see no backtrace after the crash, this may mean that the possibility to connect debugger to the running processes is disabled in your distribution (for example, Ubuntu after version 10.10). This behavior is controlled by the ptrace_scope sysctl value. If it equals to 1 ptrace calls from external processes are not allowed. A value that equals to 0 allows external processes to examine memory of the other process.
In such cases, to enable a backtrace creation, temporarily open the root shell and execute the following command:
echo 0 > /proc/sys/kernel/yama/ptrace_scope
If you want to enable a backtrace creation permanently, you need to edit the /etc/sysctl.d/10-ptrace.conf file as root, and set the value to 0. Then, run as root to reload sysctl settings, as follows:
sysctl -p
After this, repeat the steps to reproduce the crash, copy the backtrace, and attach it to your bug report or e-mail.
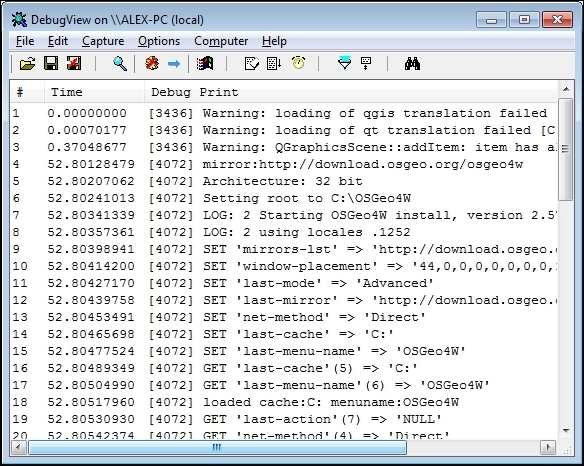
DebugView is a small program for the Windows operating system that allows you to view and save the debug output of programs. With its help, you can easily get the QGIS debug output and add it to your bug report.
To get the debug output with DebugView, follow these steps:
- Download DebugView from the Microsoft site at https://technet.microsoft.com/en-us/sysinternals/bb896647.aspx.
- Extract the archive to some folder on your hard drive and launch
Dbgview.exe. - Start QGIS and perform the actions that lead to a crash or an error:
- Save the log to a file using the Save button on the DebugView toolbar.
- Attach the saved file to your bug report or e-mail.
Also, if QGIS crashes, it produces a minidump file (usually these files are created in your
Tempdirectory and have thetmp.mdmpextension), as shown in the following screenshot: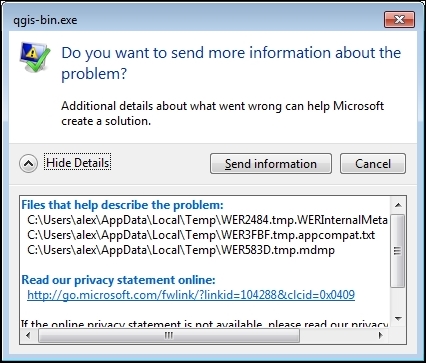
- This file should also be attached to the bug report, as it allows developers to understand the problem better even if they cannot reproduce the crash on their computers.
A backtrace is a summary of program functions that are still active. In other words, it shows all nested functions and calls from the program's start to the crash point. With the help of a backtrace, developers can isolate place where the bug is.
If you have access to computers with different operating systems, it would be good to check whether this error is reproduced in different environments.
Almost all modern computers and laptops have enough performance to run virtual machines. The snapshots feature is available in the most popular virtual machines. You can have a clean and up-to-date system with recent QGIS for testing and debugging purposes.
- More information about backtrace creation can be found on the QGIS site at http://qgis.org/en/site/getinvolved/development/index.html#creating-a-backtrace