Table of Contents for
OpenLayers 3.x Cookbook - Second Edition
 OpenLayers 3.x Cookbook - Second Edition
Published by
Packt Publishing, 2016
OpenLayers 3.x Cookbook - Second Edition
Published by
Packt Publishing, 2016
- Cover
- Table of Contents
- OpenLayers 3.x Cookbook Second Edition
- OpenLayers 3.x Cookbook Second Edition
- Credits
- About the Authors
- About the Reviewer
- www.PacktPub.com
- Preface
- What you need for this book
- Who this book is for
- Sections
- Conventions
- Reader feedback
- Customer support
- 1. Web Mapping Basics
- Creating a simple fullscreen map
- Playing with the map's options
- Managing the map's stack layers
- Managing the map's controls
- Moving around the map view
- Restricting the map's extent
- 2. Adding Raster Layers
- Using Bing imagery
- Using OpenStreetMap imagery
- Adding WMS layers
- Changing the zoom effect
- Changing layer opacity
- Buffering the layer data to improve map navigation
- Creating an image layer
- Setting the tile size in WMS layers
- 3. Working with Vector Layers
- Adding a GML layer
- Adding a KML layer
- Creating features programmatically
- Exporting features as GeoJSON
- Reading and creating features from a WKT
- Using point features as markers
- Removing or cloning features using overlays
- Zooming to the extent of a layer
- Adding text labels to geometry points
- Adding features from a WFS server
- Using the cluster strategy
- Reading features directly using AJAX
- Creating a heat map
- 4. Working with Events
- Creating a side-by-side map comparator
- Implementing a work-in-progress indicator for map layers
- Listening for the vector layer features' events
- Listening for mouse or touch events
- Using the keyboard to pan or zoom
- 5. Adding Controls
- Adding and removing controls
- Working with geolocation
- Placing controls outside the map
- Drawing features across multiple vector layers
- Modifying features
- Measuring distances and areas
- Getting feature information from a data source
- Getting information from a WMS server
- 6. Styling Features
- Styling layers
- Styling features based on geometry type
- Styling based on feature attributes
- Styling interaction render intents
- Styling clustered features
- 7. Beyond the Basics
- Working with projections
- Creating a custom control
- Selecting features by dragging out a selection area
- Transitioning between weather forecast imagery
- Using the custom OpenLayers library build
- Drawing in freehand mode
- Modifying layer appearance
- Adding features to the vector layer by dragging and dropping them
- Making use of map permalinks
- Index
We already saw how to perform some basic layer appearance modifications in the Changing layer opacity recipe in Chapter 2, Adding Raster Layers. We also saw how to reorder the layer stack and show or hide layers. This kind of layer modification may be sufficient for the majority of web-mapping applications, but we're going to take a look at some other more advanced techniques for this recipe.
During this recipe, we will modify the appearance of the raster tiles that are returned from the tile service. As we know, raster tiles are returned as images, which means that we can manipulate the color of the images when they're applied through the canvas renderer.
Color manipulation can also be performed on the server (perhaps a proxy server) before returning the modified tiles to the browser. Alternatively, if you're in control of the tile service itself, you could offer the raster tiles in a different color scheme.
We, of course, will look at how this can be achieved in the JavaScript code on the client's side. We will be using the ol.source.Raster layer source for the first time in this book. It offers a way to transform input pixel values into different pixel values for output, as specified by us.
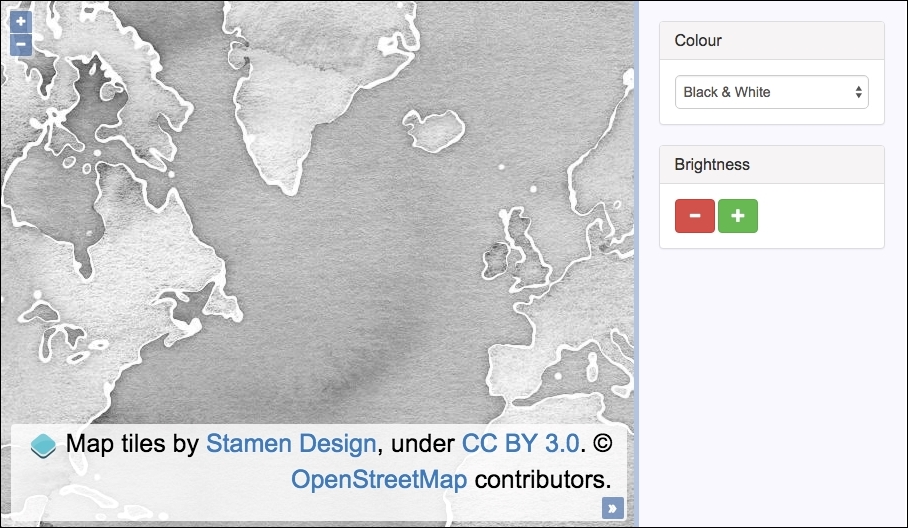
We are going to offer the ability to switch the layer between black, white, and other colors. We will also allow the user to adjust the lightness of the layer. The source code can be found in ch07/ch07-modifying-layer-appearance. The screenshot of the finished application is displayed next, where the user has switched the layer to black and white mode.
Be mindful of the fact that we are going to be performing operations at a low level for every pixel of a raster tile. This does consume computing power, and performance issues may be noticeable (that is, the layer may take some time to transform from one color scheme to another). Consider the users that you are supporting in your application and appropriately pick the best technology and capabilities for this type of task.
For some of the color manipulations, we are going to convert them between different color spaces (RGB to HCL and vice versa). We are also going to modify the brightness of the colors. We will lean on the great D3 color library (https://github.com/d3/d3-color) to take care of the grunt work for us so that we can focus on the application code. Download the D3 color library, as we'll be referencing it within the HTML.
- Create a new HTML file and include the OpenLayers dependencies and a
divelement to hold the map. As mentioned in the Getting ready section of this recipe, also include theD3color library. In particular, we have the following markup for the controls inside the side panel:<form> <select id="js-colour"> <option value="colour">Colour</option> <option value="blackAndWhite">Black & White</option> </select> <button id="js-darker"></button> <button id="js-lighter"></button> </form> - Create a custom JavaScript file and subscribe to the color select
changeevent, forcing the source to rerender:var selectElem = document.getElementById('js-colour'); selectElem.addEventListener('change', function() { raster.changed(); }); - Set up the default darker and lighter properties, subscribe to the
clickevent on each button, update the relevant brightness properties, and force the source to rerender:var goDarker = { enable: false, level: 0.1 }; document.getElementById('js-darker') .addEventListener('click', function() { goDarker.enable = true; raster.changed(); }); var goLighter = { enable: false, level: 0.1 }; document.getElementById('js-lighter') .addEventListener('click', function() { goLighter.enable = true; raster.changed(); }); - Create the raster source with the pixel operations to modify the layer appearance:
var raster = new ol.source.Raster({ sources: [ new ol.source.Stamen({ layer: 'watercolor' }) ], threads: 0, operation: function(pixels, data) { if (pixels[0][0] == 0 && pixels[0][1] == 0 && pixels[0][2] == 0) { return [0, 0, 0, 0]; } var rgb = d3_color.rgb( pixels[0][0], pixels[0][1], pixels[0][2] ); if (data.blackAndWhite) { var hcl = d3_color.hcl(rgb); hcl.c = 0; rgb = d3_color.rgb(hcl); } if (data.goDarker) { rgb = rgb.darker(data.level); } else if (data.goLighter) { rgb = rgb.brighter(data.level); } return [rgb.r, rgb.g, rgb.b, 255]; } }); - Set the correct attributions for the raster source, as follows:
raster.setAttributions(ol.source.Stamen.ATTRIBUTIONS);
- Prepare some configuration for the layer manipulation before the pixel operations actually occur:
raster.on(ol.source.RasterEventType.BEFOREOPERATIONS, function(event) { var data = event.data; data.blackAndWhite = selectElem.value === 'blackAndWhite'; if (goDarker.enable) { data.goDarker = true; data.level = goDarker.level; goDarker.enable = false; goDarker.level += 0.1; goLighter.level -= 0.1; } else if (goLighter.enable) { data.goLighter = true; data.level = goLighter.level; goLighter.enable = false; goLighter.level += 0.1; goDarker.level -= 0.1; } }); - Instantiate a new instance of
map:var map = new ol.Map({ layers: [ new ol.layer.Image({source: raster}) ], target: 'js-map', view: new ol.View({ center: [-4383204, 6985732], zoom: 3 }) });
We've used the Bootstrap CSS framework to style and organize the HTML, which has been omitted for brevity. Please view the accompanying source code for the full details.
In the UI, there are controls to manipulate the layer appearance. The select menu contains two options to transform the tiles between colors or black and white. We subscribe to the change event and force the raster source to rerender by calling raster.changed() from within our handler:
selectElem.addEventListener('change', function() {
  raster.changed();
});
By kicking off a render, the pixel operations are performed, which is explained, as follows:
var goDarker = { enable: false, level: 0.1 };
document.getElementById('js-darker')
    .addEventListener('click', function() {
        goDarker.enable = true;
        raster.changed();
    });
We set up a goDarker object, specifying some current state. It tracks whether or not it's enabled and also the current level. Before we perform the pixel operations, we need to know what user action has taken place to trigger the rerender of the layer. In order to achieve this, we keep this object up-to-date accordingly.
If the user presses the darker (minus) button for the first time, the tiles are darkened by an amount of 0.1 of the original, and the level gets incremented to 0.2. If the user wants to go darker again, the level of increment will be 0.2 this time, making the layer a total of 0.2 darker than the original color, and so on. We can see how the level is incremented in later explanations.
We subscribe to the click event on the button, set the enable property on the goDarker object to true, and trigger the raster source to rerender.
We apply the same setup and logic for the lighter button, so we won't go into any more details here, as it should be self-explanatory from the previous discussion.
The raster source setup spans over many lines, so let's break it down into smaller pieces for explanation:
var raster = new ol.source.Raster({
  sources: [
    new ol.source.Stamen({
      layer: 'watercolor'
    })
  ],
A raster source allows us to perform arbitrary manipulations on pixel values, which is exactly what we want to do. The first property, sources, expects an array of sources that will provide the input for manipulation. We pass in a source from the Stamen tile provider.
threads: 0,
The next property is threads, which we set to zero. By default, OpenLayers performs the pixel operations in a worker thread for performance gains. In doing so, it introduces some complexities around scope, where functions and values must be passed to the thread context; otherwise, they'll be unavailable. For demonstration purposes, we avoided this complexity. For a good introduction on worker threads, visit http://www.html5rocks.com/en/tutorials/workers/basics/. Remember to check for browser support when implementing these advanced capabilities (http://caniuse.com/#search=workers).
operation: function(pixels, data) {
    if (pixels[0][0] == 0 && pixels[0][1] == 0 && pixels[0][2] == 0) {
      return [0, 0, 0, 0];
    }
The operation property is provided with the function that'll process the input pixel data and then return the modified pixel data, which will be assigned to the raster source.
The pixels argument is an array. The first item of the array contains the RGB values within an array of their own. This is the data that we're most interested in.
If each pixel in the array has a zero value for red, green, and blue, then we return early to avoid performing any transforms that may trigger JavaScript NaN (not a number) errors. We return an array of zeros, which is the same as the data that was delivered to this operation.
    var rgb = d3_color.rgb(
      pixels[0][0],
      pixels[0][1],
      pixels[0][2]
    );
In order to perform some pixel color manipulation with the D3 color library, we first take the pixel input and convert it to a D3 RGB object using the d3_color.rgb method and store the result in a variable, namely rgb. The pixels[0][0] input corresponds to red, pixels[0][1] corresponds to green, and so on.
    if (data.blackAndWhite) {
      var hcl = d3_color.hcl(rgb);
      hcl.c = 0;
      rgb = d3_color.rgb(hcl);
    }
If the data.blackAndWhite property is true, this means that the user has the select menu value as Black & White. To transform the color to grayscale, we must set the chroma attribute of the HCL color space to zero. In order to do this, we first convert the color from the RGB color space to the HCL color space using the d3_color.hcl method. Once we have the color in HCL, we update the chroma property (hcl.c) to zero. We then return back to the RGB color space that OpenLayers expects (rgb = d3_color.rgb(hcl)).
    if (data.goDarker) {
      rgb = rgb.darker(data.level);
    }
    else if (data.goLighter) {
      rgb = rgb.brighter(data.level);
}If the user has requested to go darker or lighter, we assign a new RGB color to the rgb variable by calling either the method darker or brighter on the D3 RGB object and supplying the current brightness level (data.level).
return [rgb.r, rgb.g, rgb.b, 255];
Finally, we return an array, with indexes 0-2 forming the manipulated RGB content, retrieved off the D3 RGB object; that is, rgb.r is for red.
This completes the setup of our raster source, but we also need to perform some tasks prior to the raster source operations. For this, we subscribe to the before operations event on the raster source:
raster.on(ol.source.RasterEventType.BEFOREOPERATIONS,function(event) {
  var data = event.data;
  data.blackAndWhite = selectElem.value === 'blackAndWhite';
When the before operations event is published, it provides us with an opportunity to extend the event.data object, which is passed to the operations method of the raster source (it's called data there too, as we've seen).
We attach the blackAndWhite property to the data object, which is assigned a value of true or false, depending on the evaluation of the condition (whether or not the user has selected the Black & White option from the select menu).
  if (goDarker.enable) {
    data.goDarker = true;
    data.level = goDarker.level;
    goDarker.enable = false;
    goDarker.level += 0.1;
    goLighter.level -= 0.1;
  }
If the user has clicked on the minus button to go darker, the goDarker property of data is assigned true. We also retrieve the current level of the darkness that is to be applied (goDarker.level) and assign this value to data.level for use inside the operations function.
As these changes (to go darker) will be applied to the next operation but not necessarily to the operation following that one, we must update the goDarker object accordingly. We mark it as disabled (goDarker.enable = false) and increment the darkness level, which is used for the next step of darkness (goDarker.level += 0.1).
Importantly, we also decrement the level of the goLighter object. The lightness must be relative to the darkness, so if the darkness has increased, the level of brightness will decrease. This ensures a smooth consistency when adjusting between brightness levels.
We perform similar (but reversed) logic if the user has made the layer lighter, rather than darker. We hope the preceding explanation will cover the details of this as well.
We used the verbose lookup for the event type of before operations: ol.source.RasterEventType.BEFOREOPERATIONS. The result is a string of 'beforeoperations', which we could have used instead. However, it's interesting to understand where these events are registered in the OpenLayers code.
There is also an after operations event (ol.source.RasterEventType.AFTEROPERATIONS). As an idea, if you think your operations could be long running and affect performance, then you could consider displaying a loading graphic on before operations, then hiding the loading graphic once the after operations event is published.