Table of Contents for
OpenLayers 3.x Cookbook - Second Edition
 OpenLayers 3.x Cookbook - Second Edition
Published by
Packt Publishing, 2016
OpenLayers 3.x Cookbook - Second Edition
Published by
Packt Publishing, 2016
- Cover
- Table of Contents
- OpenLayers 3.x Cookbook Second Edition
- OpenLayers 3.x Cookbook Second Edition
- Credits
- About the Authors
- About the Reviewer
- www.PacktPub.com
- Preface
- What you need for this book
- Who this book is for
- Sections
- Conventions
- Reader feedback
- Customer support
- 1. Web Mapping Basics
- Creating a simple fullscreen map
- Playing with the map's options
- Managing the map's stack layers
- Managing the map's controls
- Moving around the map view
- Restricting the map's extent
- 2. Adding Raster Layers
- Using Bing imagery
- Using OpenStreetMap imagery
- Adding WMS layers
- Changing the zoom effect
- Changing layer opacity
- Buffering the layer data to improve map navigation
- Creating an image layer
- Setting the tile size in WMS layers
- 3. Working with Vector Layers
- Adding a GML layer
- Adding a KML layer
- Creating features programmatically
- Exporting features as GeoJSON
- Reading and creating features from a WKT
- Using point features as markers
- Removing or cloning features using overlays
- Zooming to the extent of a layer
- Adding text labels to geometry points
- Adding features from a WFS server
- Using the cluster strategy
- Reading features directly using AJAX
- Creating a heat map
- 4. Working with Events
- Creating a side-by-side map comparator
- Implementing a work-in-progress indicator for map layers
- Listening for the vector layer features' events
- Listening for mouse or touch events
- Using the keyboard to pan or zoom
- 5. Adding Controls
- Adding and removing controls
- Working with geolocation
- Placing controls outside the map
- Drawing features across multiple vector layers
- Modifying features
- Measuring distances and areas
- Getting feature information from a data source
- Getting information from a WMS server
- 6. Styling Features
- Styling layers
- Styling features based on geometry type
- Styling based on feature attributes
- Styling interaction render intents
- Styling clustered features
- 7. Beyond the Basics
- Working with projections
- Creating a custom control
- Selecting features by dragging out a selection area
- Transitioning between weather forecast imagery
- Using the custom OpenLayers library build
- Drawing in freehand mode
- Modifying layer appearance
- Adding features to the vector layer by dragging and dropping them
- Making use of map permalinks
- Index
We can summarize that there are two ways to style a feature. The first is by applying the style to the layer so that every feature inherits this styling, as seen in the Styling layers recipe. The second is to apply the styling options directly to the feature, which we'll see in this recipe.
This recipe shows us how we can choose which flavor of styling to apply to a feature, depending on the geometry type. We will apply the style directly to the feature using the ol.Feature method, setStyle.
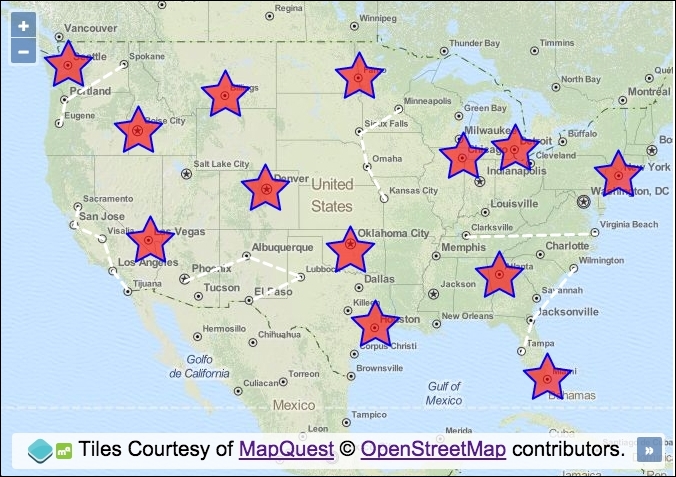
When a point geometry type is detected, we will actually style the representing geometry as a star, rather than the default circle shape. Other styling will be applied when a geometry type of line string is detected.
The source code can be found in ch06/ch06-styling-features-by-geometry-type, and the output of the recipe will look like the following screenshot:
To customize the feature styling based on the geometry type, use the following steps:
- Create the HTML file with OpenLayers dependencies, the jQuery library, and a
divelement that will hold themapinstance: - Create a custom JavaScript file and initialize a new
mapinstance, as follows:var map = new ol.Map({ view: new ol.View({ zoom: 4, center: [-10732981, 4676723] }), target: 'js-map', layers: [ new ol.layer.Tile({ source: new ol.source.MapQuest({layer: 'osm'}) }) ] - Create a new vector layer and add it to the
map. Have the source loader function retrieve the GeoJSON file, format the response, then pass it through our custommodifyFeaturesmethod (which we'll implement next) before adding the features to the vector source:var vectorLayer = new ol.layer.Vector({ source: new ol.source.Vector({ loader: function() { $.ajax({ type: 'GET', url: 'features.geojson', context: this }).done(function(data) { var format = new ol.format.GeoJSON(); var features = format.readFeatures(data); this.addFeatures(modifyFeatures(features)); }); } }) }); map.addLayer(vectorLayer); - Finish off by implementing the
modifyFeaturesfunction so that it transforms the projection ofgeometryand styles the feature based on the geometry type:function modifyFeatures(features) { features.forEach(function(feature) { var geometry = feature.getGeometry(); geometry.transform('EPSG:4326', 'EPSG:3857'); if (geometry.getType() === 'Point') { feature.setStyle( new ol.style.Style({ image: new ol.style.RegularShape({ fill: new ol.style.Fill({ color: [255, 0, 0, 0.6] }), stroke: new ol.style.Stroke({ width: 2, color: 'blue' }), points: 5, radius1: 25, radius2: 12.5 }) }) ); } if (geometry.getType() === 'LineString') { feature.setStyle( new ol.style.Style({ stroke: new ol.style.Stroke({ color: [255, 255, 255, 1], width: 3, lineDash: [8, 6] }) }) ); } }); return features; }
Let's take a brief look at the loader function of the vector source before we make a closer examination of the logic behind the styling:
loader: function() {
  $.ajax({
    type: 'GET',
    url: 'features.geojson',
    context: this
  }).done(function(data) {
    var format = new ol.format.GeoJSON();
    var features = format.readFeatures(data);
    this.addFeatures(modifyFeatures(features));
  });
}
We saw how this type of source loading worked in Chapter 3, Working with Vector Layers in the recipe, Reading features directly using AJAX, but as a quick reminder of some of the aspects in relation to this recipe, we'll discuss the done promise content once the AJAX response has been received.
Our external resource contains points and line strings in the format of GeoJSON, so we must create a new instance of ol.format.GeoJSON so that we can read in the data (format.readFeatures(data)) of the AJAX response to build out a collection of OpenLayers features.
Before adding the group of features straight to the vector source (this refers to the vector source here), we pass the array of features through our modifyFeatures method. This method will apply all the necessary styling to each feature, then return the modified features back in place, and feed the result to the addFeatures method. Let's break down the contents of our modifyFeatures method:
function modifyFeatures(features) {
  features.forEach(function(feature) {
    var geometry = feature.getGeometry();
    geometry.transform('EPSG:4326', 'EPSG:3857');
The logic begins by looping over each feature in the array using the JavaScript array method, forEach. The first argument passed to the anonymous iterator function is the feature (feature).
Within the loop iteration, we store this feature's geometry in a variable, namely geometry, as this is accessed more than once during the loop iteration.
Unbeknown to you, the projection of coordinates within the GeoJSON file are in longitude/latitude, projection code EPSG:4326. The map's view, however, is in projection EPSG:3857. To ensure that they appear where intended on the map, we use the transform geometry method, which takes the source and the destination projections as arguments and converts the coordinates of the geometry in place.
if (geometry.getType() === 'Point') {
  feature.setStyle(
    new ol.style.Style({
      image: new ol.style.RegularShape({
        fill: new ol.style.Fill({
          color: [255, 0, 0, 0.6]
        }),
        stroke: new ol.style.Stroke({
          width: 2, color: 'blue'
        }),
        points: 5, radius1: 25, radius2: 12.5
      })
    })
  );
}
Next up is a conditional check on whether or not the geometry is a type of Point. The geometry instance has the method getType for this kind of purpose.
Inline of the setStyle method of the feature instance, we create a new style object from the ol.style.Style constructor. The only direct property that we're interested in is the image property.
As the default, point geometries are styled as a circle. Instead, we want to style the point as a star. We can achieve this through the use of the ol.style.RegularShape constructor. We set up a fill style with a color property and the stroke style with the width and color properties.
The points property specifies the number of points for the star. In the case of a polygon shape, it represents the number of sides.
The radius1 and radius2 properties are specifically to design star shapes for the configuration of the inner and outer radius, respectively.
if (geometry.getType() === 'LineString') {
  feature.setStyle(
    new ol.style.Style({
      stroke: new ol.style.Stroke({
        color:  [255, 255, 255, 1],
        width: 3, lineDash: [8, 6]
      })
    })
  );
}
The final piece of this method has a conditional check on the geometry type of LineString. If this is the case, we style this geometry type differently to the point geometry type. We provide a stroke style with color, width, and a custom line dash. The lineDash array declares a line length of 8, which is followed by a gap length of 6.
- The Styling interaction render intents recipe
- The Styling layers recipe
- The Creating features programmatically recipe in Chapter 3, Working with Vector Layers